| Scenario | Period | Temp change (°C) | Precip change (%) |
|---|---|---|---|
| SSP2-4.5 | 2041-2060 | +1.51 | +3 |
| SSP2-4.5 | 2061-2080 | +1.96 | +6.3 |
| SSP5-8.5 | 2041-2060 | +1.89 | +5.3 |
| SSP5-8.5 | 2061-2080 | +2.97 | +9.7 |
Cambodia — Climate Indices: Baseline, Projected Change, and Ensemble Maps
QDM-downscaled CHELSA-W5E5 / NASA NEX-GDDP-CMIP6, 5-GCM ensemble
Overview
This report summarises the Quantile Delta Mapping (QDM)-downscaled, 1 km climate projections for Cambodia, derived from CHELSA-W5E5 (observed baseline, 1981-2010) and NASA NEX-GDDP-CMIP6 (5-GCM ensemble: ACCESS-CM2, MIROC6, EC-Earth3-Veg-LR, MRI-ESM2-0, IPSL-CM6A-LR), for two emissions scenarios (SSP2-4.5, SSP5-8.5), two future periods (2041-2060, 2061-2080), and all eight extreme indices produced by the process.
For each scenario, period, and index, every GCM is run through its own complete, independent pipeline, QDM downscaling first, then the index itself calculated from that model’s own corrected daily series (see Data and methods below). The ensemble mean reported here is the cell-wise mean of those five already-calculated, per-GCM index values — each GCM’s index is computed in full first, and only the five finished values are then averaged; no index is calculated from an averaged daily series. This is a “mean of means.” The Climate Profile Cambodia dashboard (WorldClim v2.1 + CMIP6) calculates its own GCM ensemble the same way. The projected change (anomaly) is then this ensemble mean future value minus the observed baseline value, per cell.
Note on the GCM ensemble: this 5-model ensemble differs slightly from the one used in the Climate Profile Cambodia dashboard. That dashboard’s WorldClim-based ensemble uses EC-Earth3-Veg, whereas this NEX-GDDP-CMIP6-based workflow uses EC-Earth3-Veg-LR, since the standard-resolution EC-Earth3-Veg run was not available through NEX-GDDP-CMIP6 at the time of processing. The other four models (ACCESS-CM2, MIROC6, MRI-ESM2-0, IPSL-CM6A-LR) are the same across both.
National annual mean change, by scenario and period
Ensemble mean (5 GCMs) change in national annual mean temperature and precipitation, relative to the 1981-2010 observed baseline.
Results
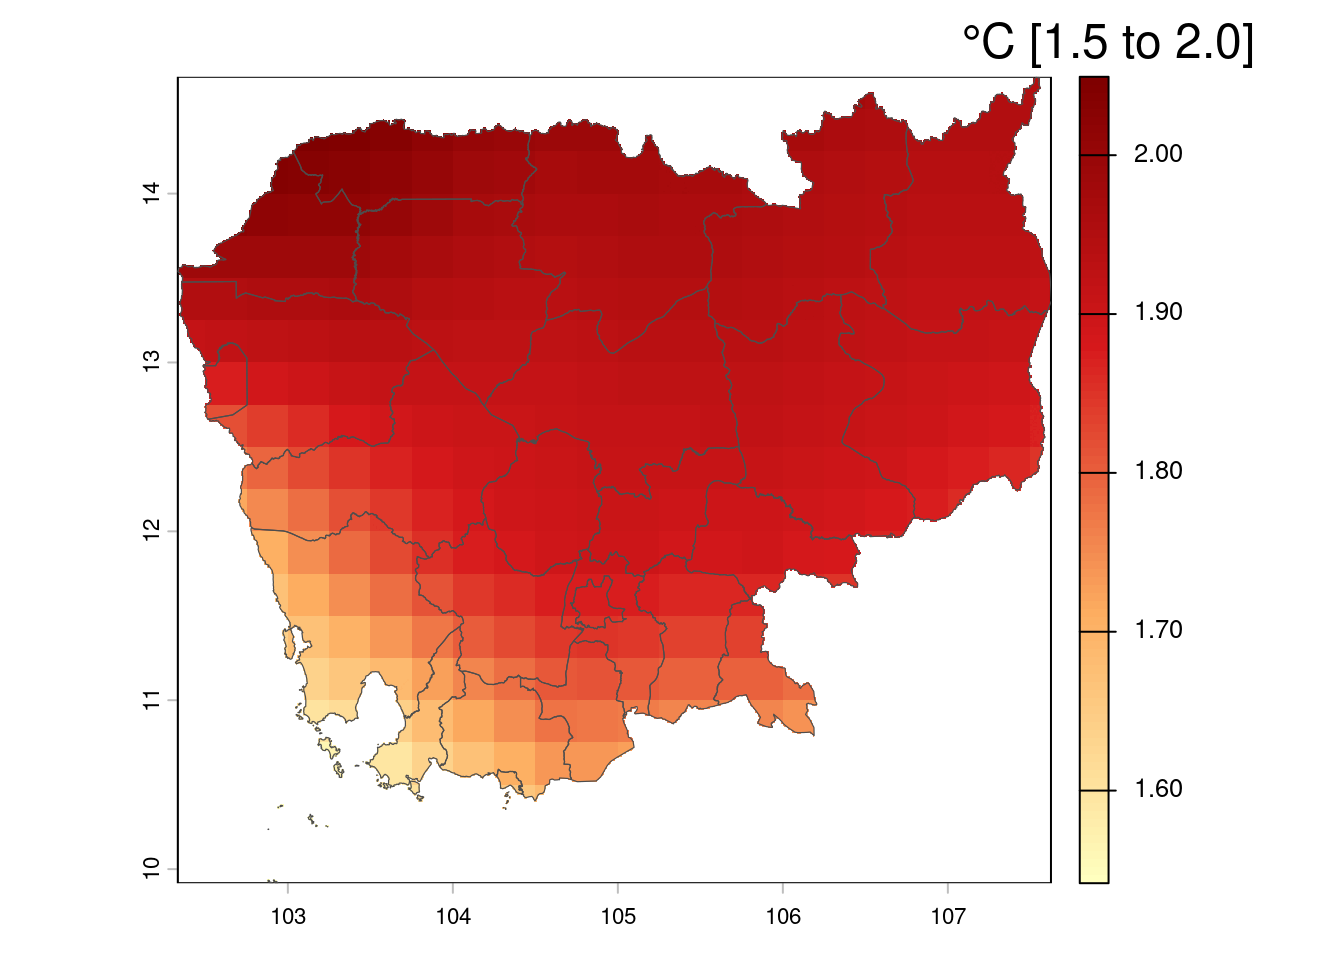
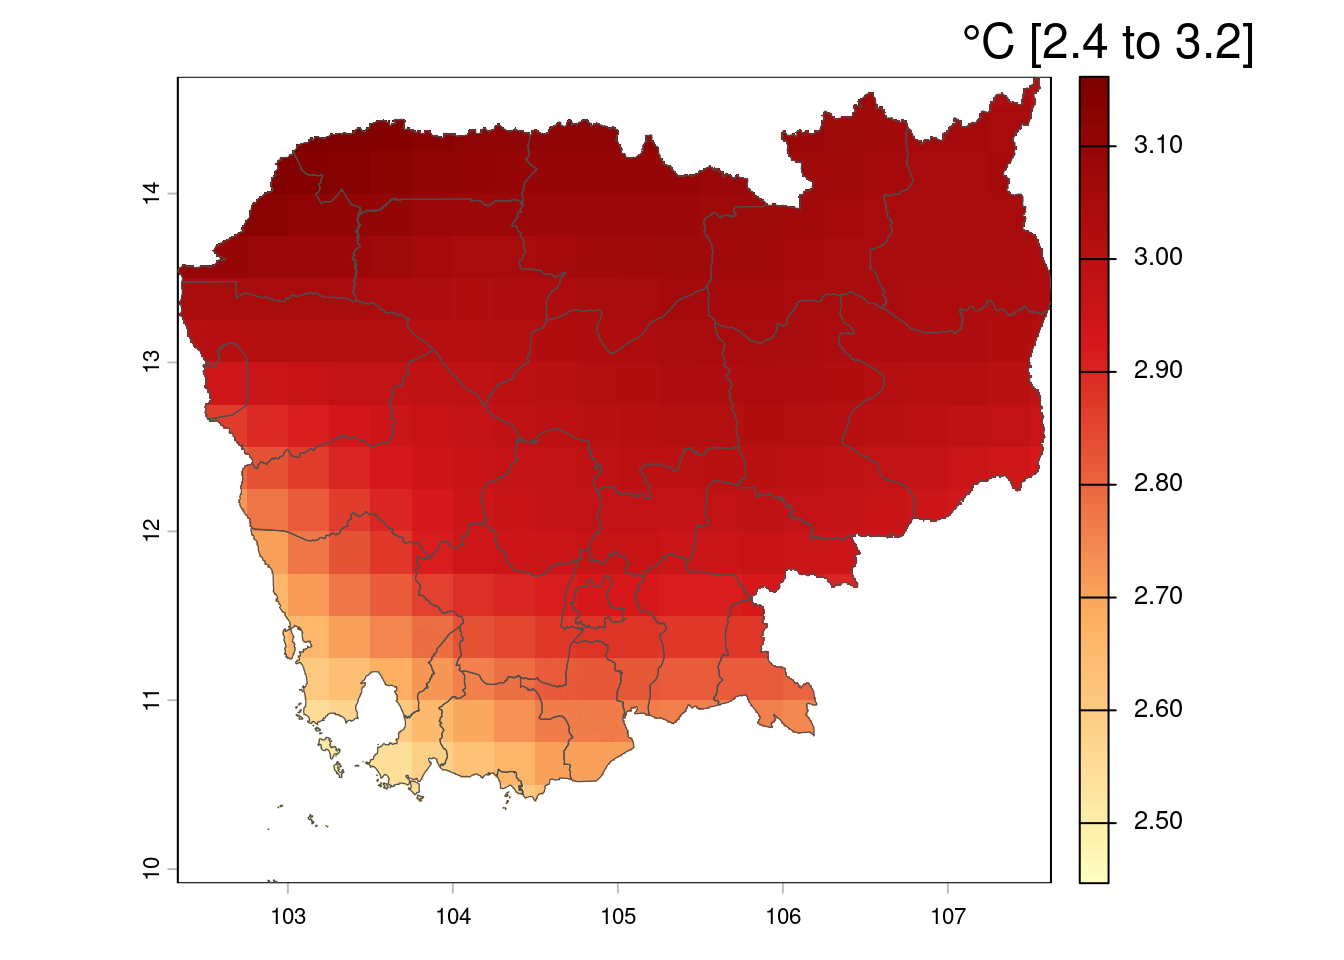
Temperature. The ensemble mean points to a consistent warming signal across every scenario and period: national annual mean temperature rises by 1.51°C (SSP2-4.5, 2041-2060) to 2.97°C (SSP5-8.5, 2061-2080). As expected, warming is larger under the higher-emissions SSP5-8.5 scenario and larger in the later (2061-2080) period than the earlier one, in both scenarios. This warming is accompanied by an increase in the number of days exceeding 35°C (HotDays35) and a higher annual hottest-day temperature (TXx) nationally, both shown in the index maps below.
Precipitation. National annual precipitation ranges from 3% to 9.7% across the four scenario/period combinations (see the table above for the exact per-scenario figures). The 5-GCM ensemble mean signal points toward wetter annual conditions nationally. This is a key finding for water resource and agricultural planning, and it should be read alongside the spatial pattern in the AnnualPrecip map below, since a national mean does not necessarily hold uniformly across every province.
An important caveat: these are annual indices. Every result above is an annual average or annual total, calculated across the whole calendar year. Averaging over a full year can mask substantial within-year shifts that matter more for practical adaptation planning than the annual figure alone. A wetter annual total could still coincide with a drier dry season and a more intense wet season, each with very different implications for, for example, rice cultivation timing, irrigation demand, and flood versus drought risk. The Climate Profile Cambodia dashboard already computes wet-season and dry-season breakdowns for temperature and precipitation; extending this same QDM-downscaled, multi-index approach to a seasonal (or monthly) basis would likely prove more directly informative for adaptation planning than the annual indices presented here.
Baseline (1981-2010): annual mean temperature and precipitation
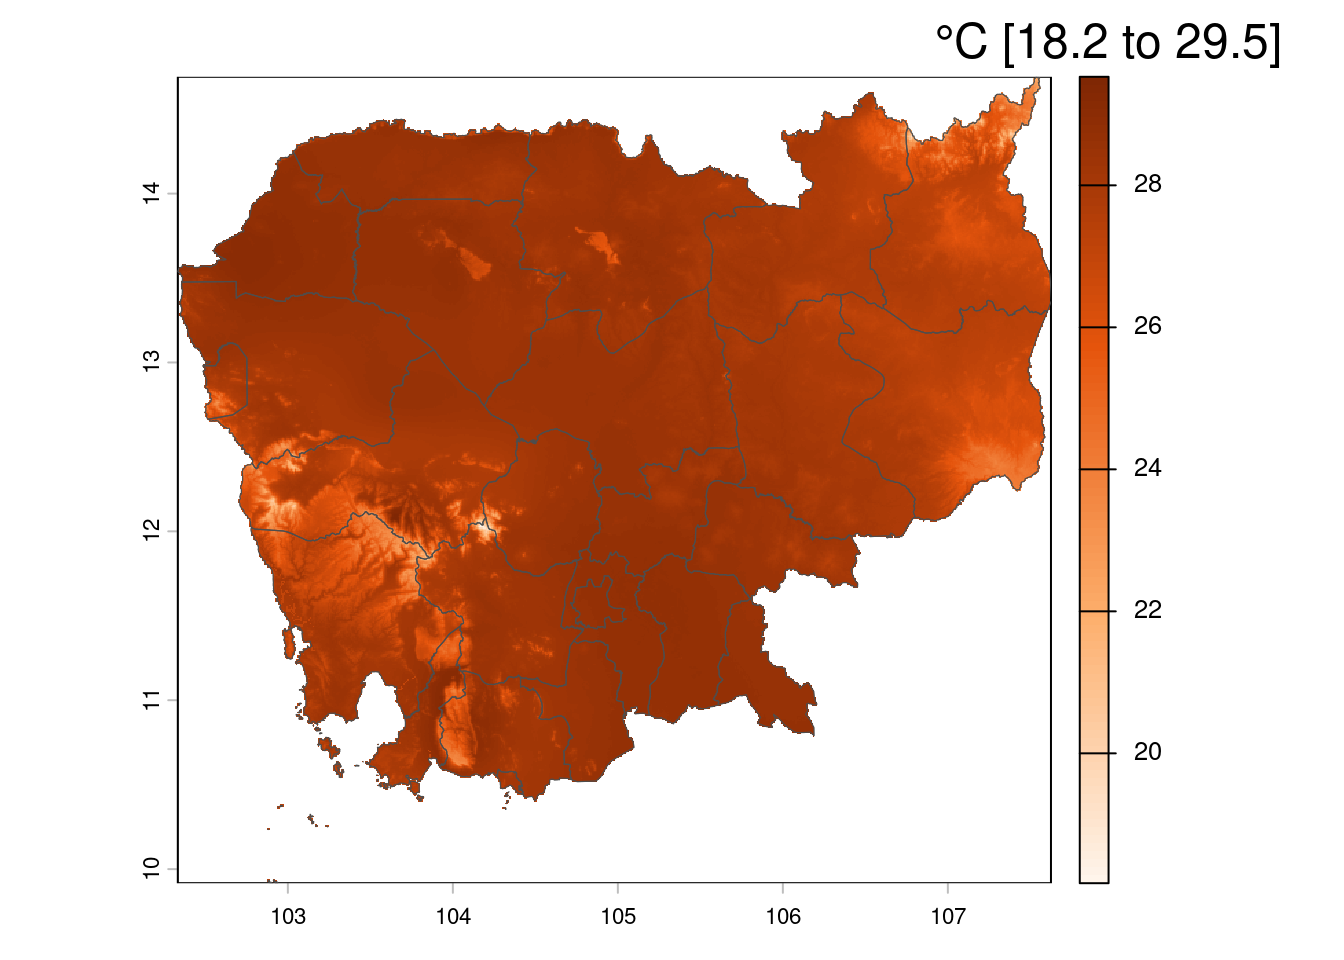
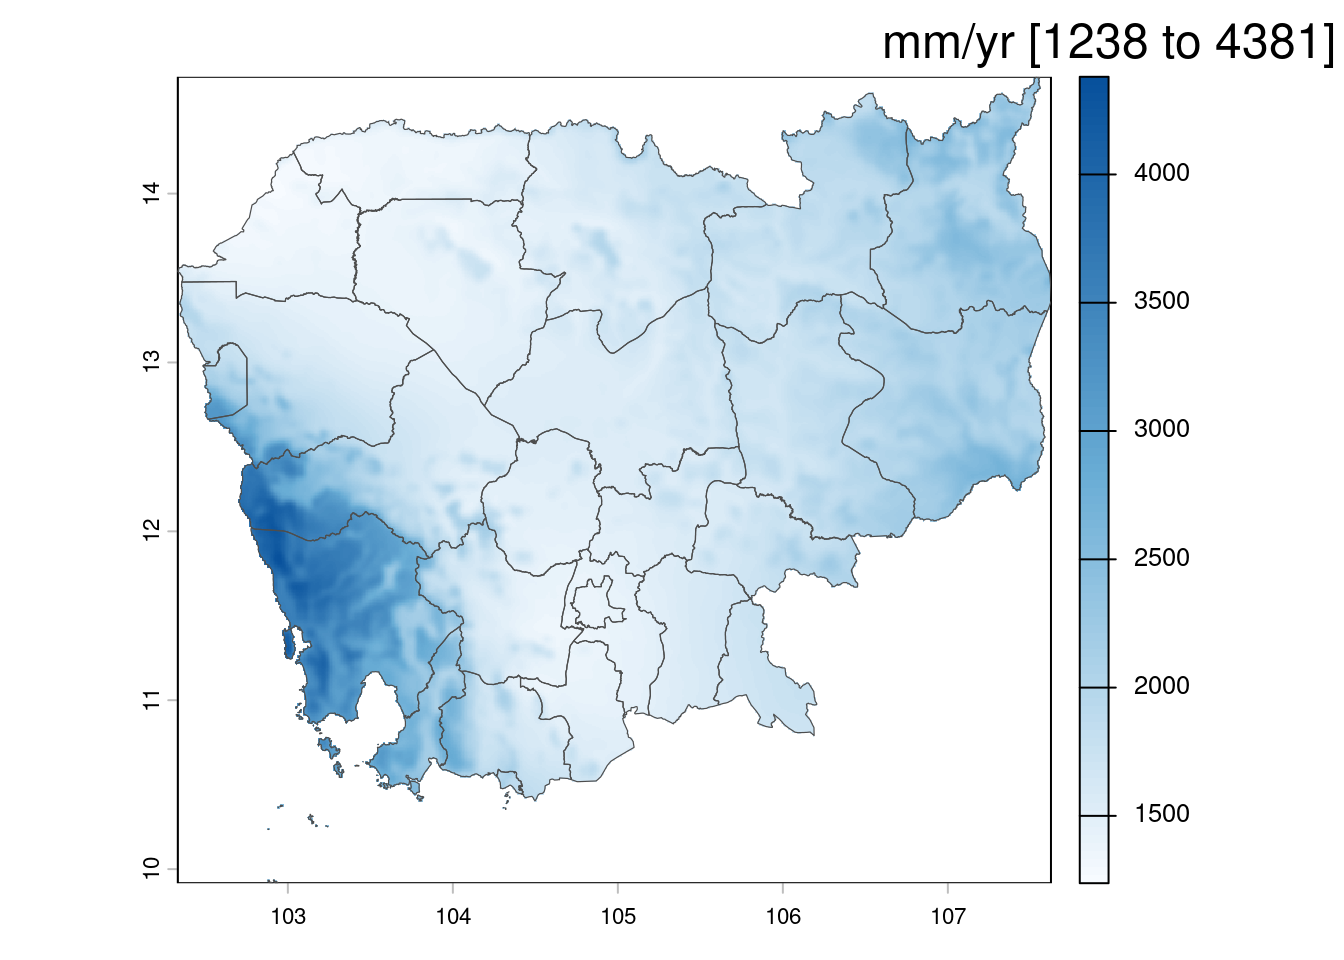
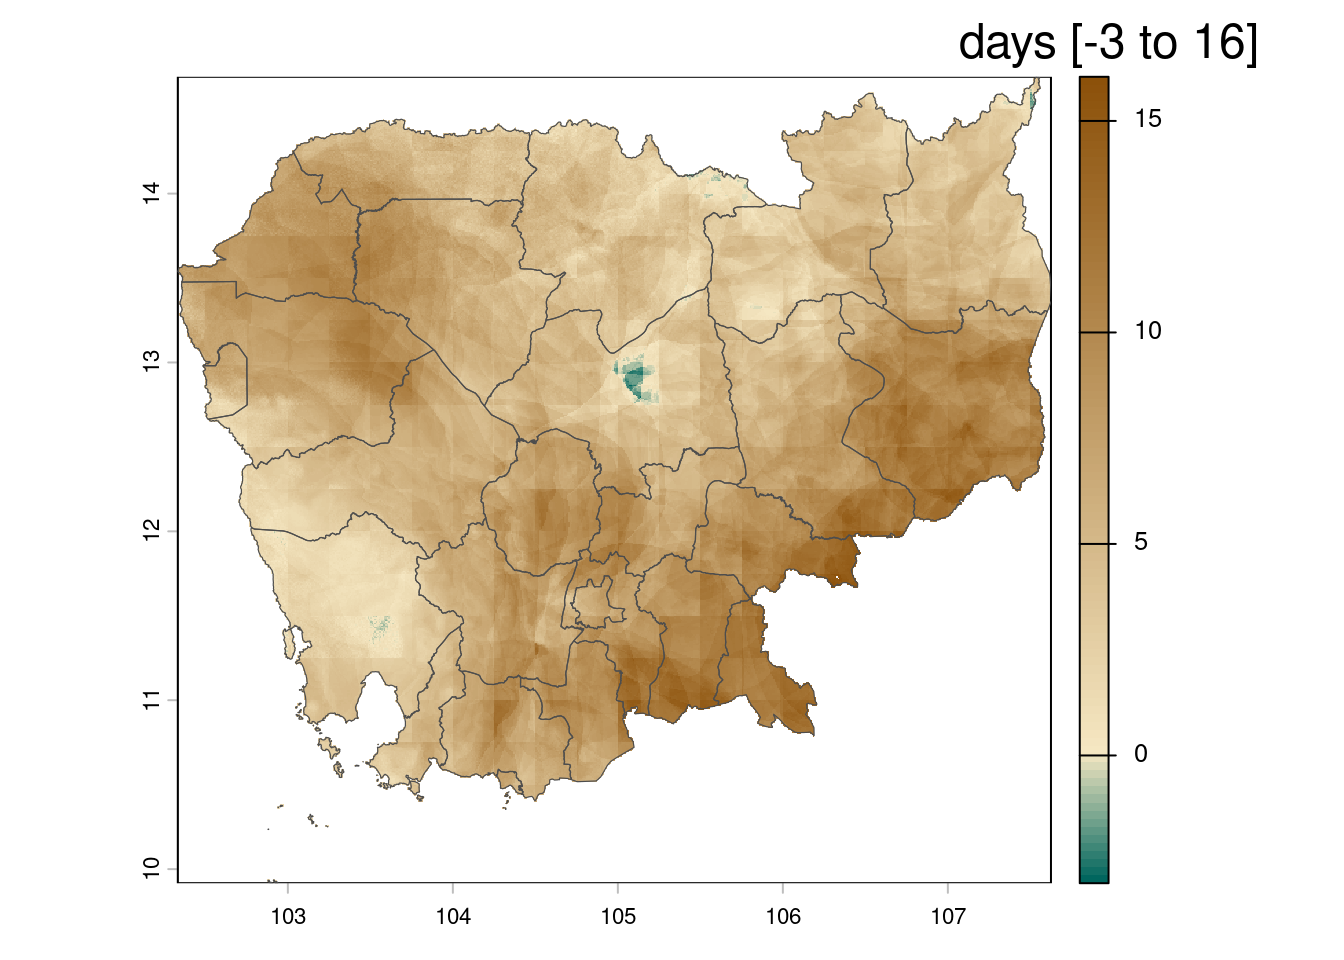
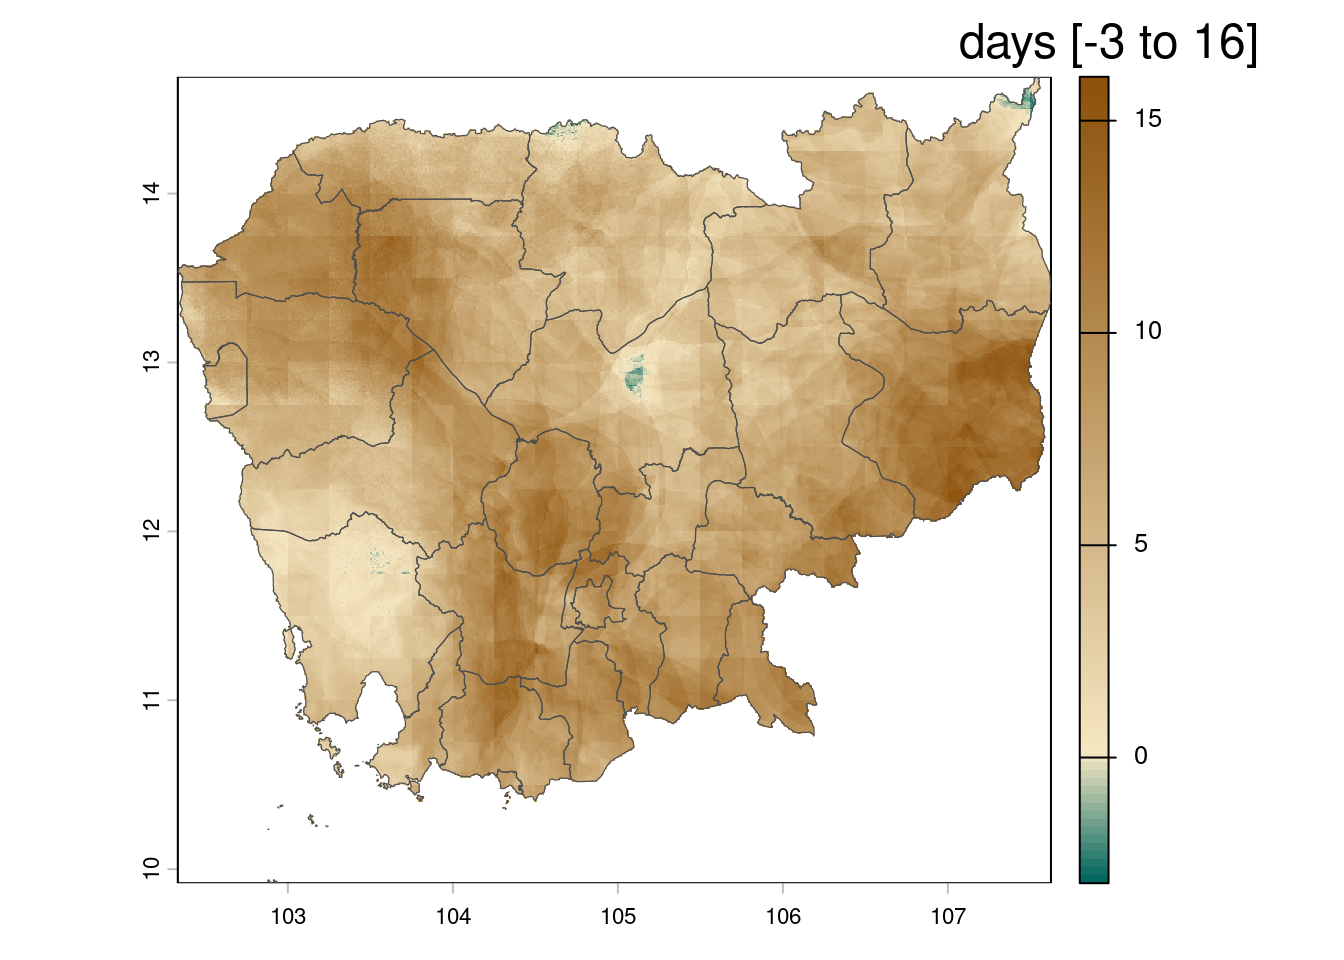
Climate index anomalies (ensemble mean change), SSP5-8.5
Each index below shows the ensemble mean change — the 5-GCM ensemble mean future value minus the observed baseline — for both future periods side by side, so the progression from mid-century (2041-2060) to late-century (2061-2080) can be compared directly for each hazard.
AnnualMeanTemp
AnnualPrecip
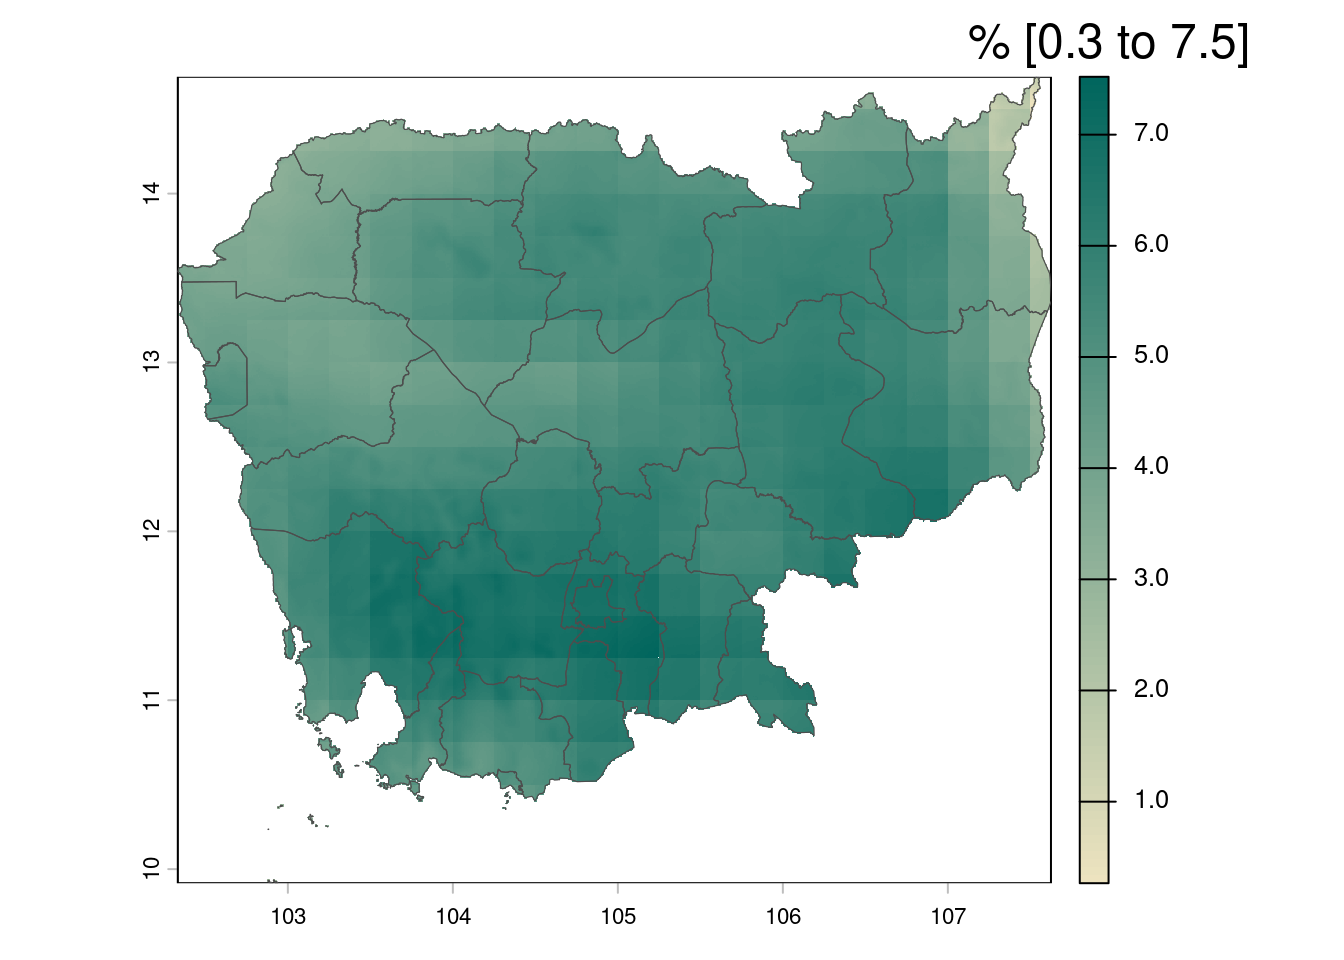
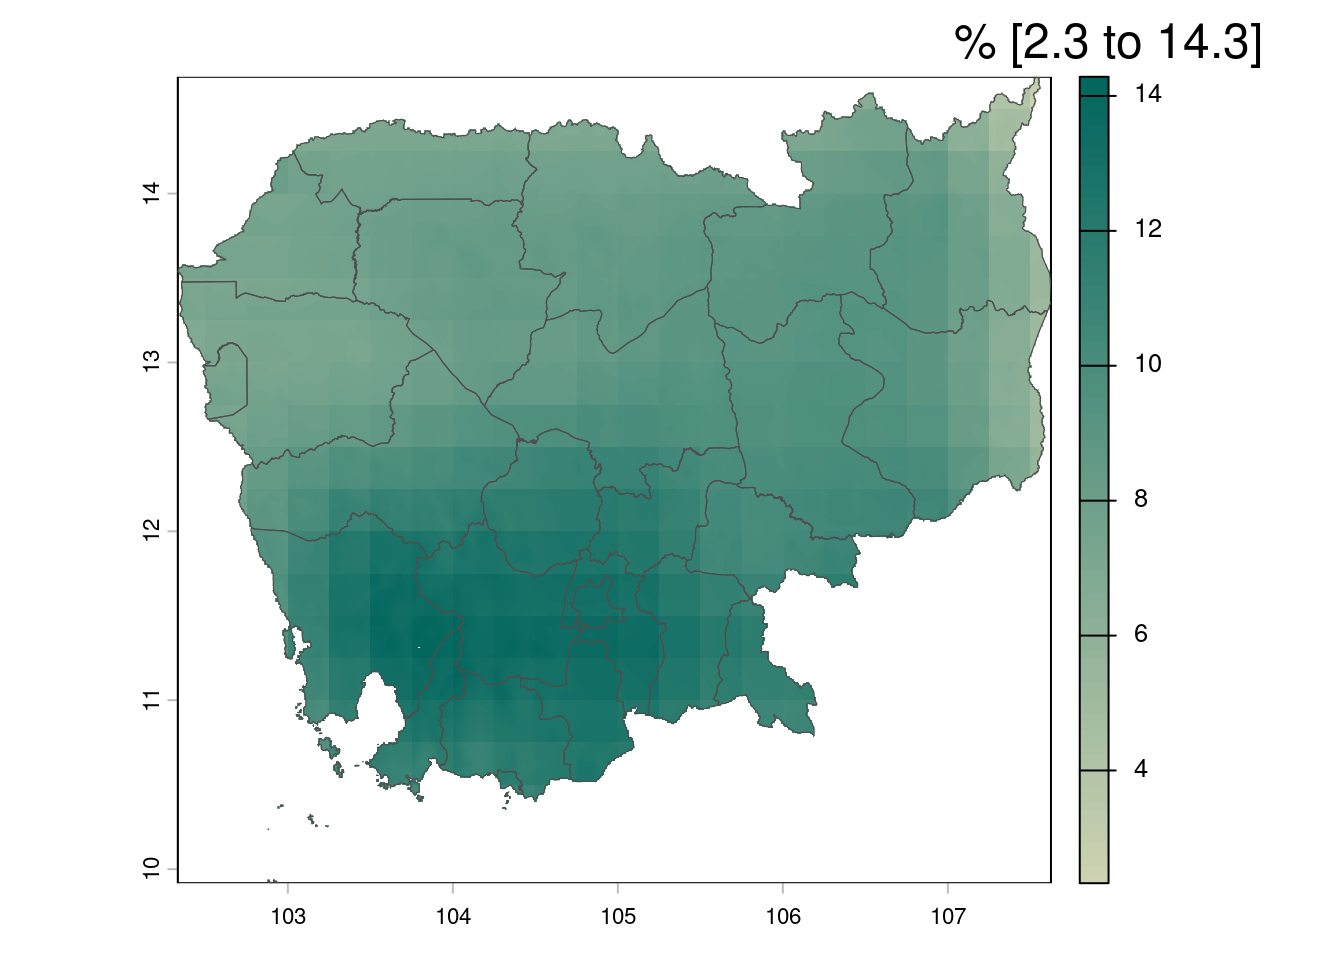
TXx
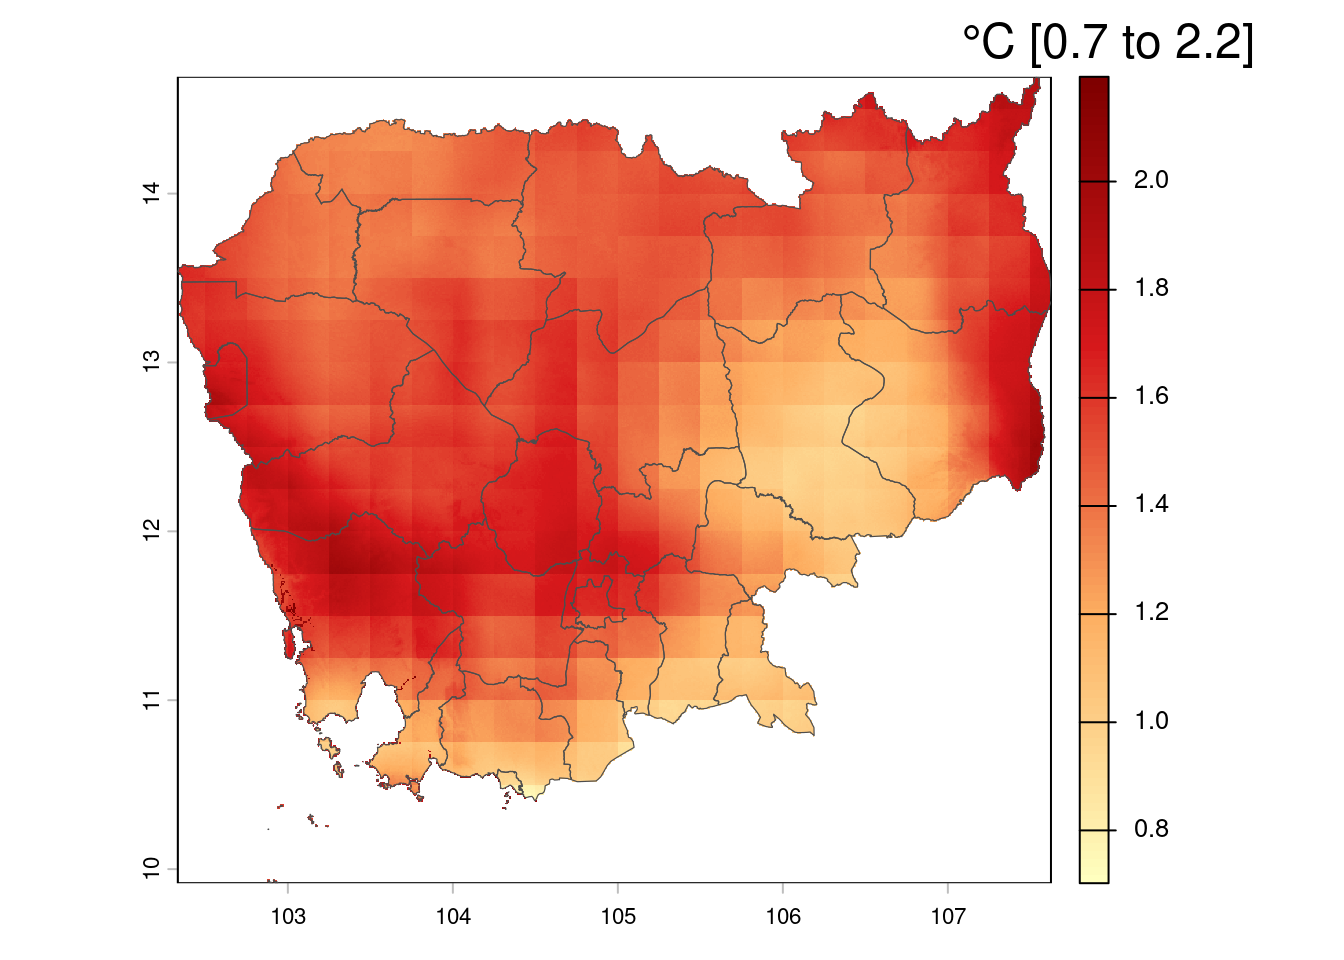
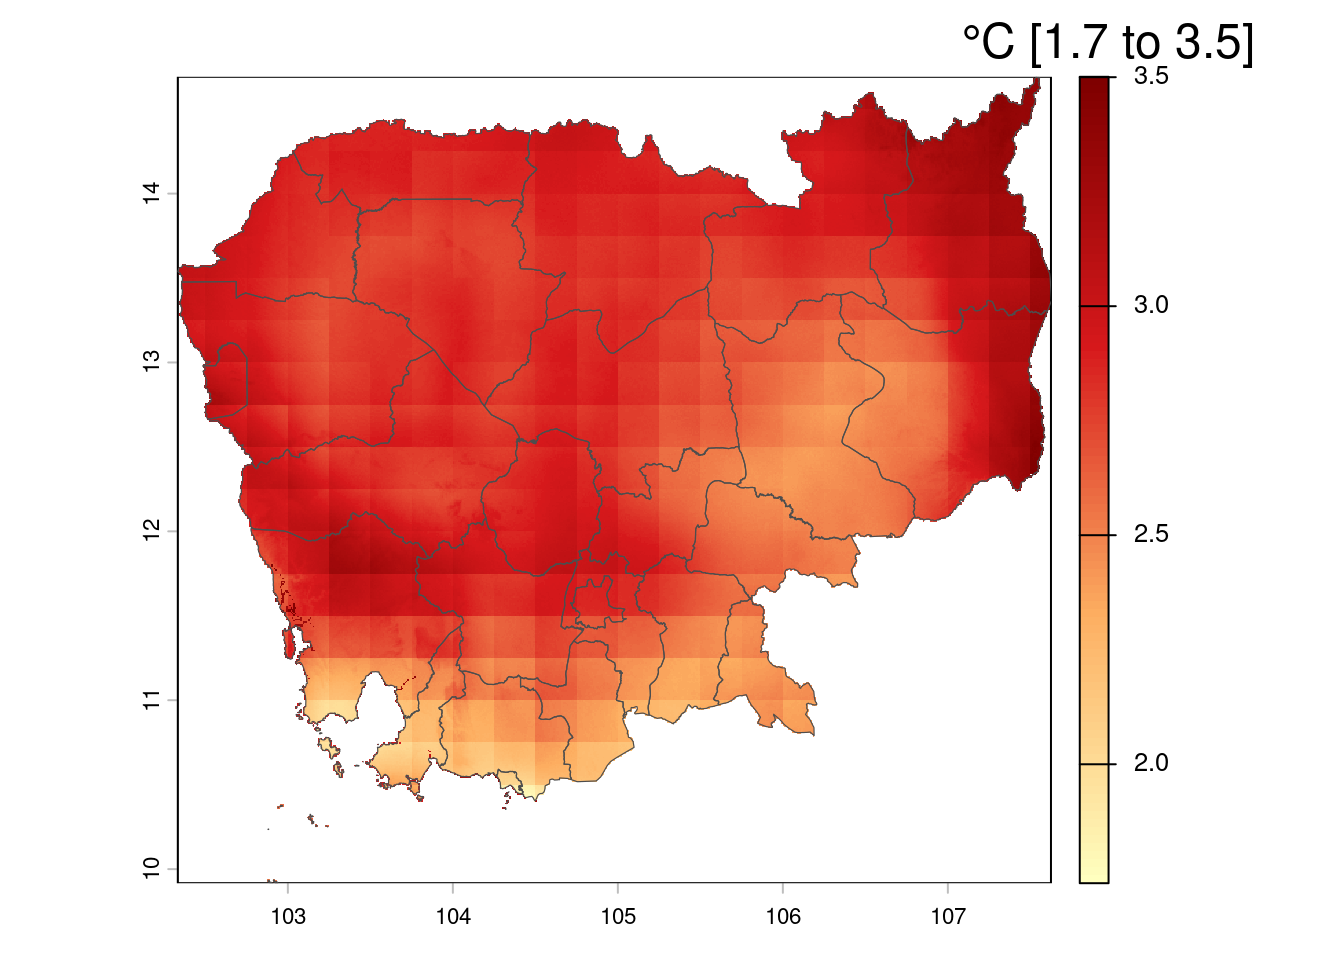
TNn
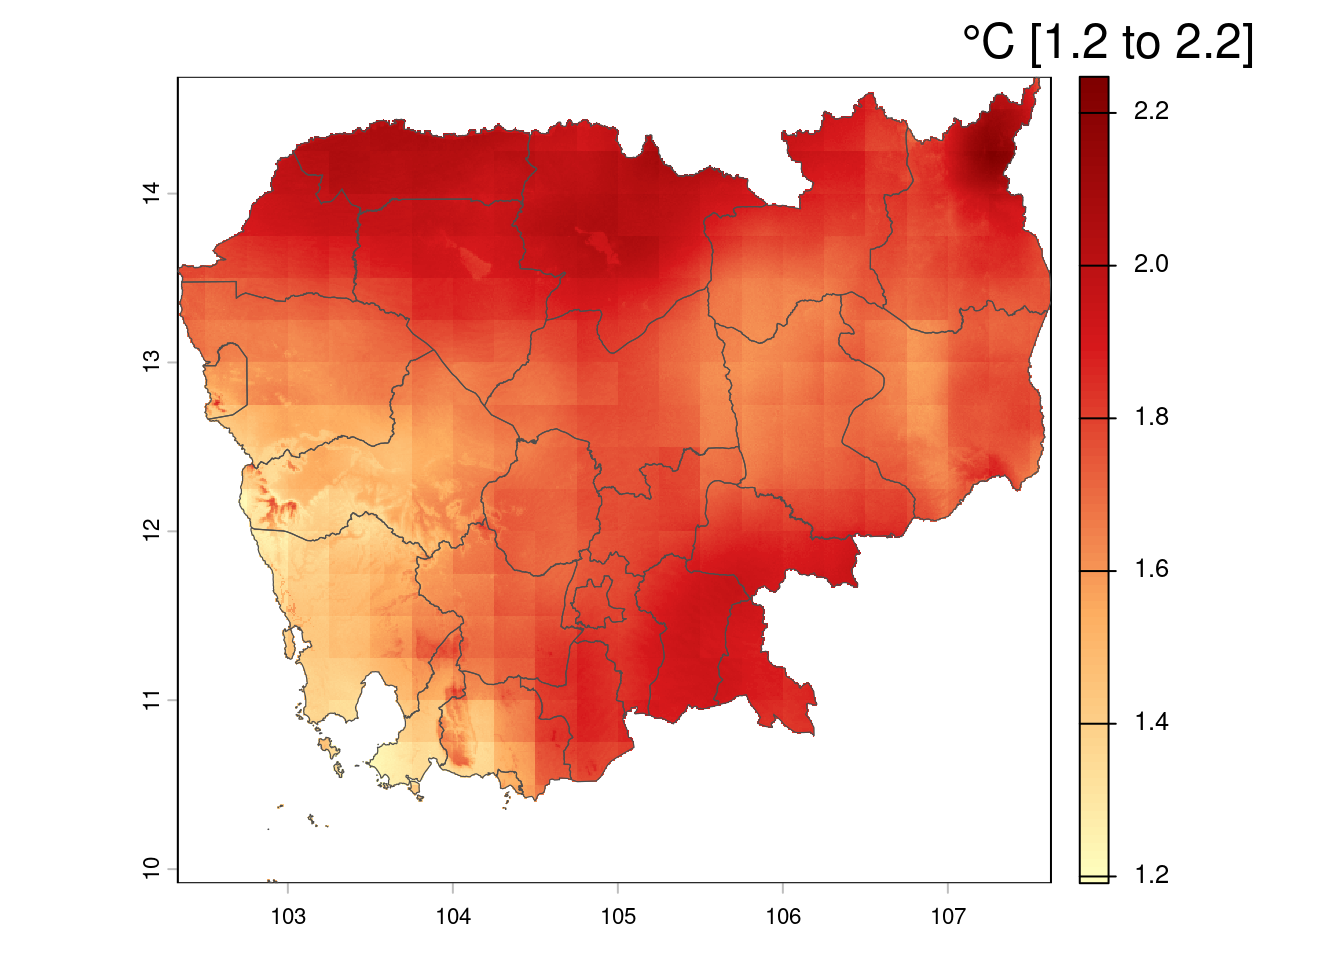
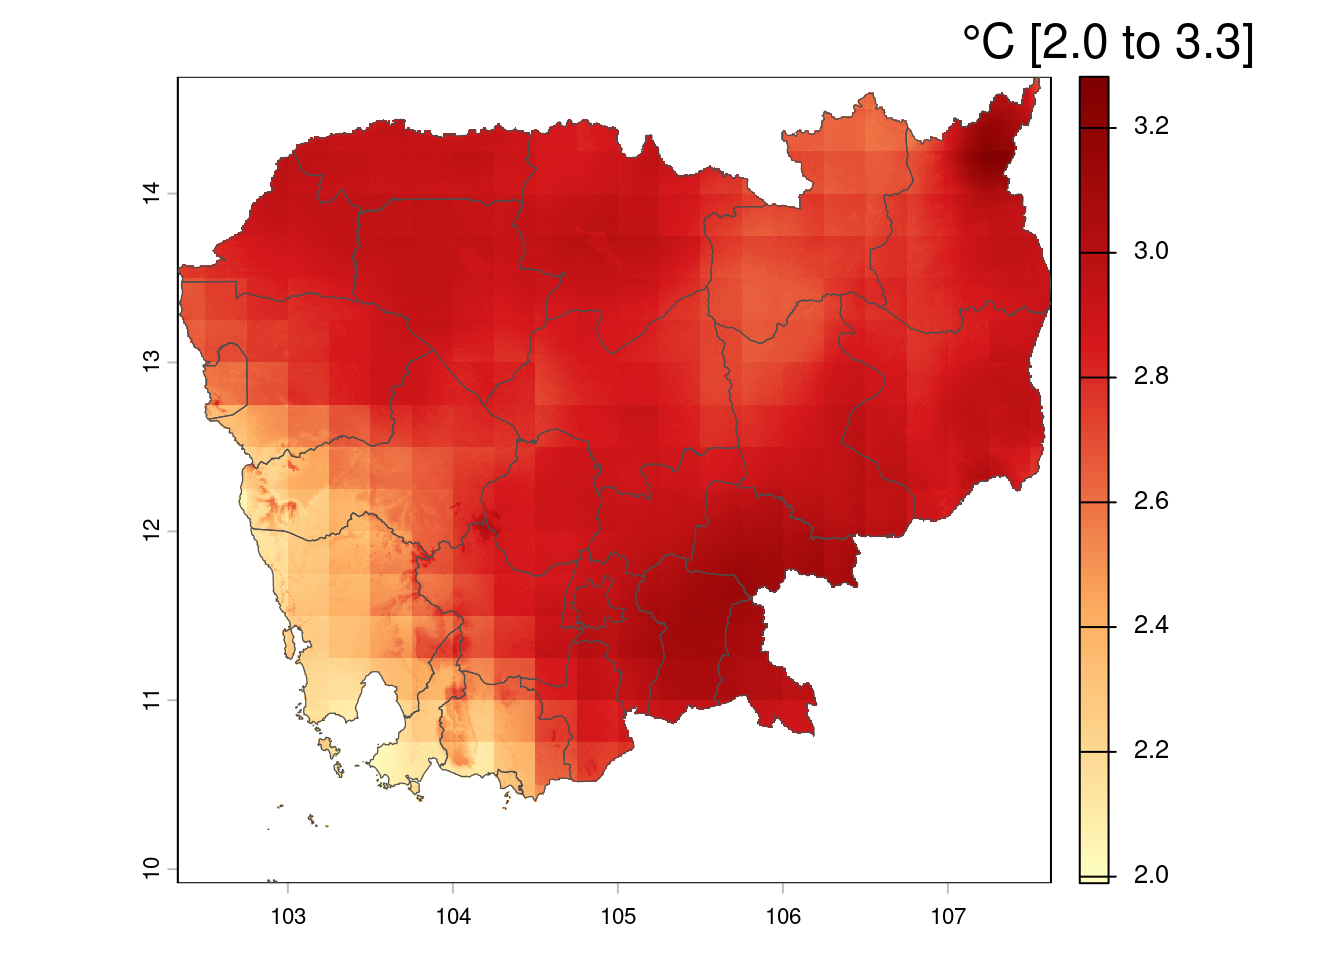
HotDays35
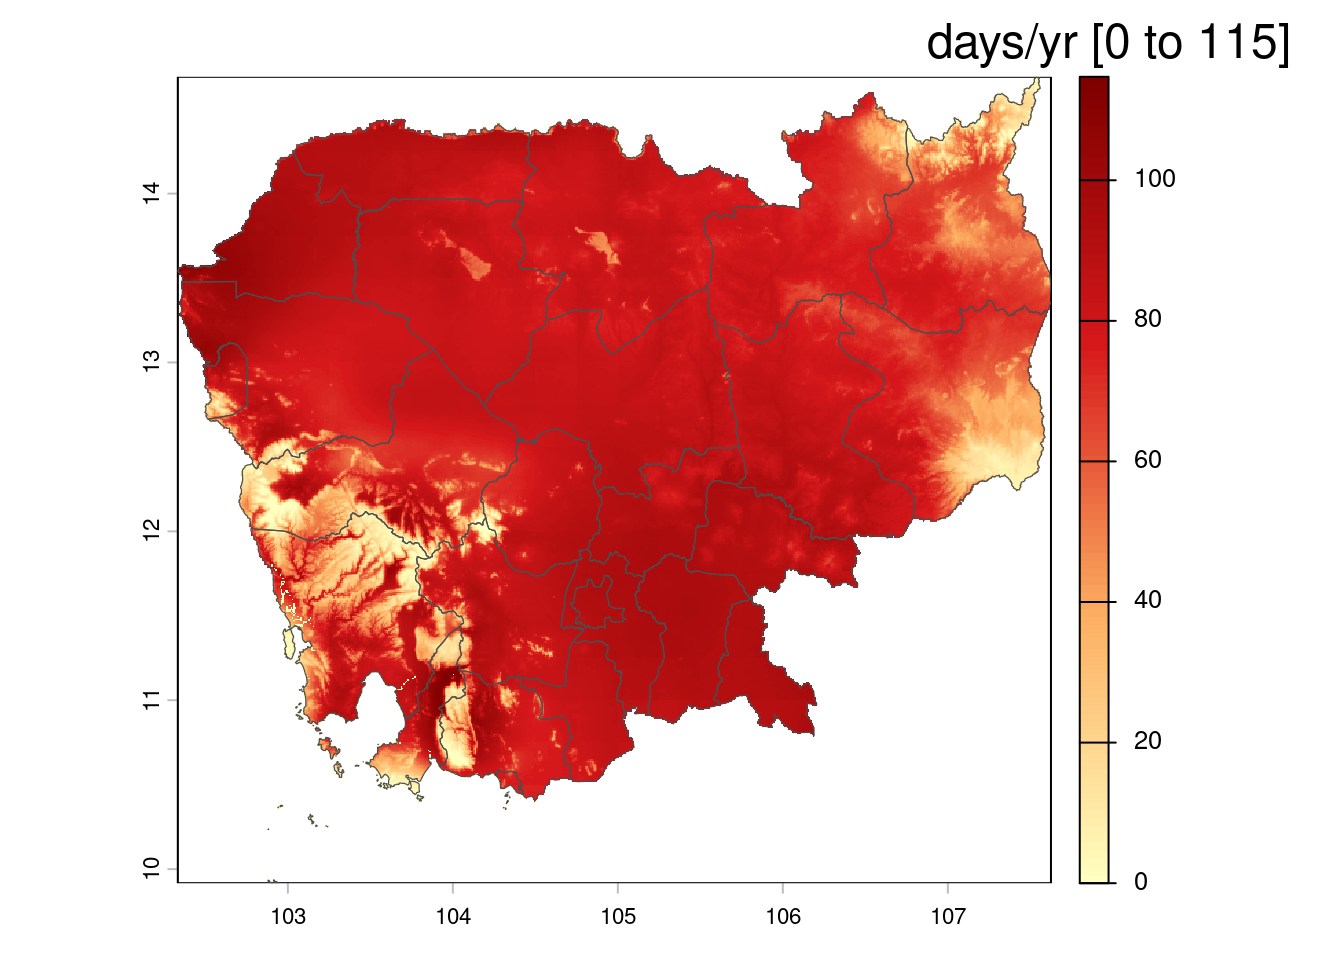
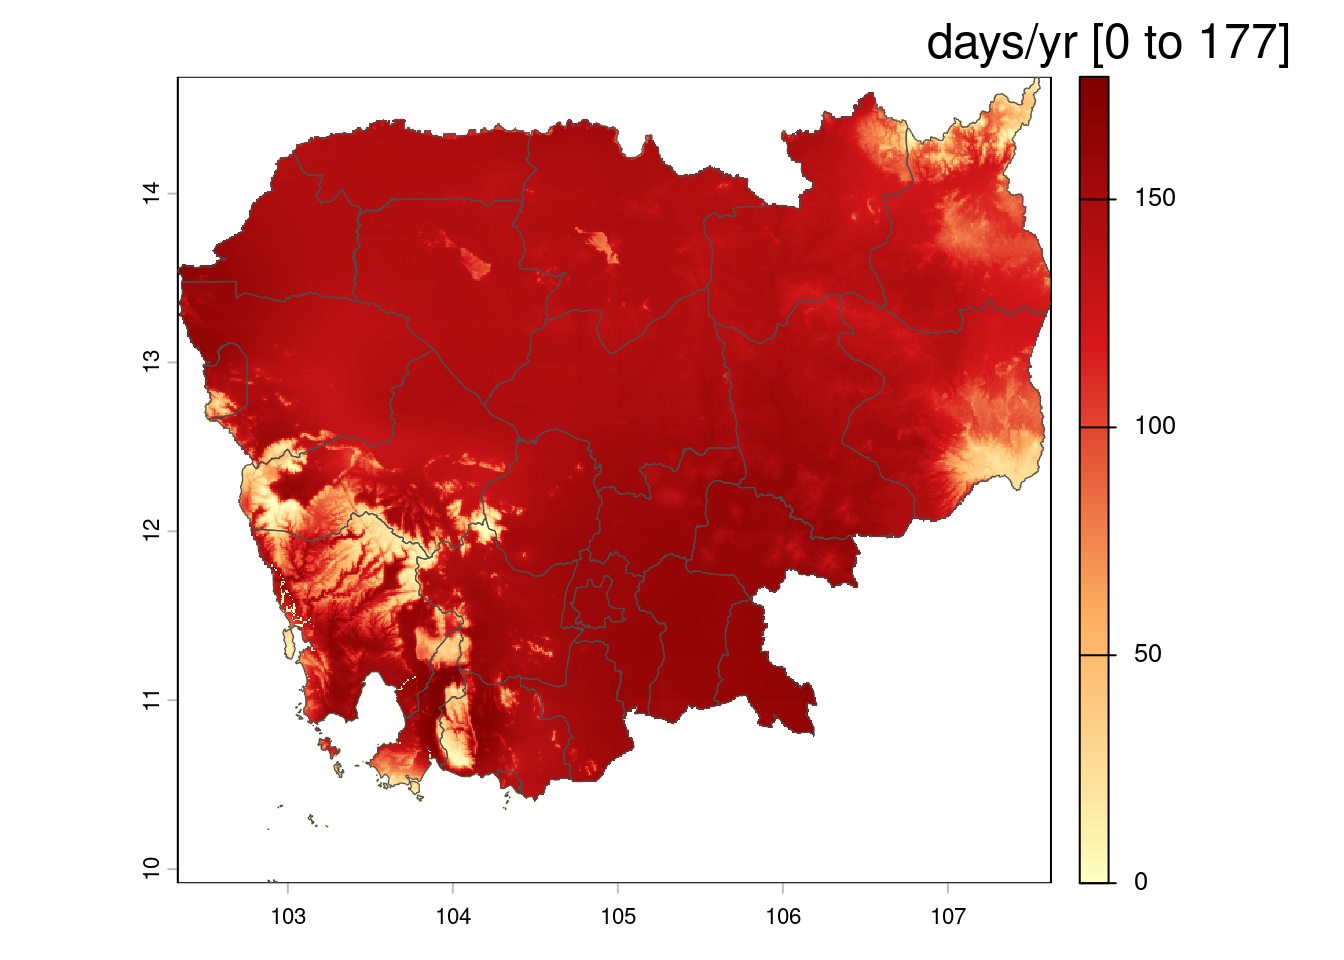
Rx1day
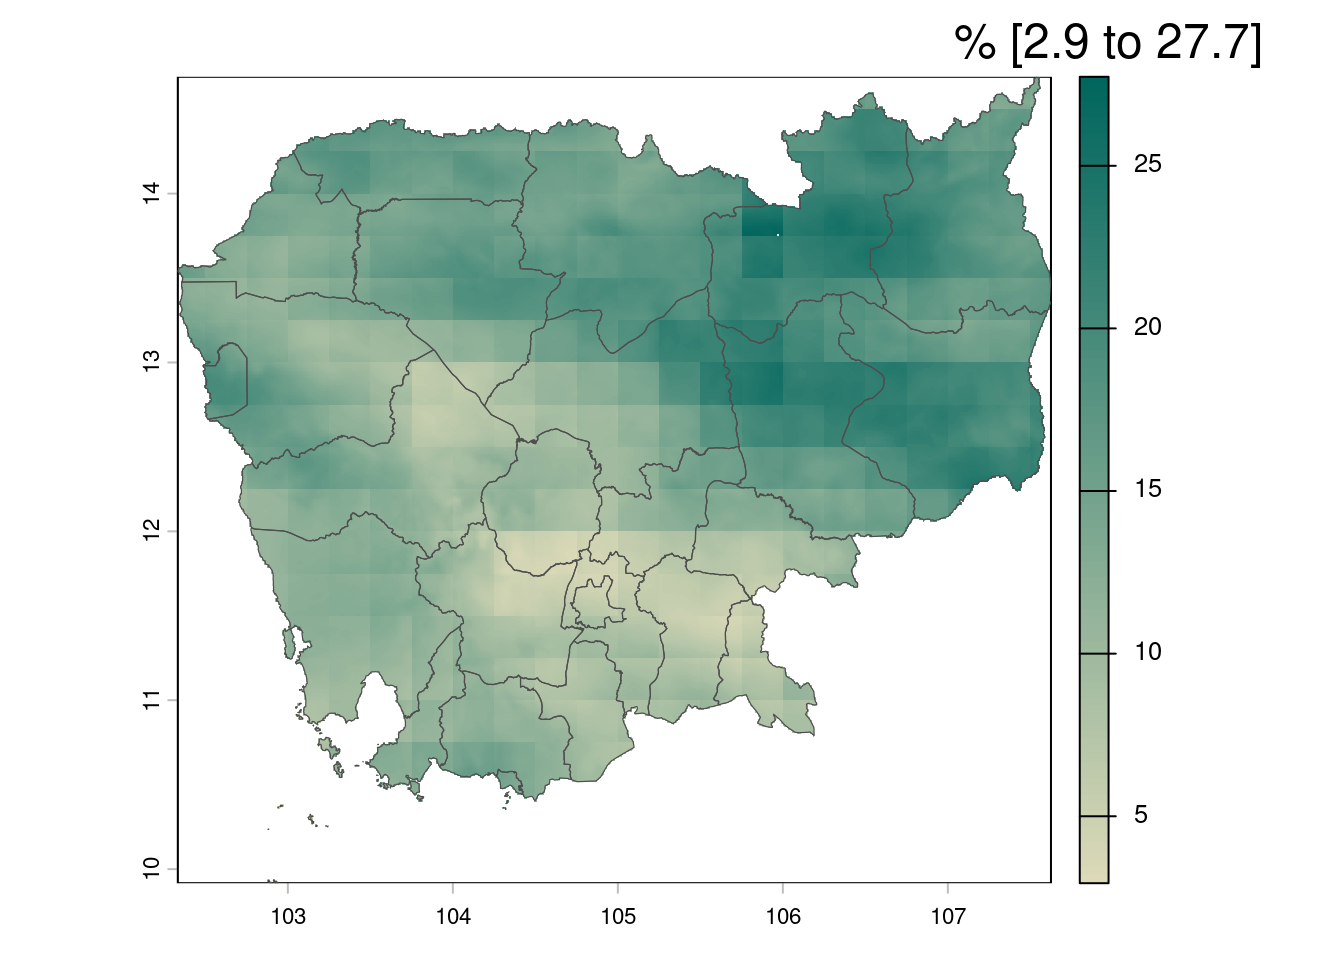
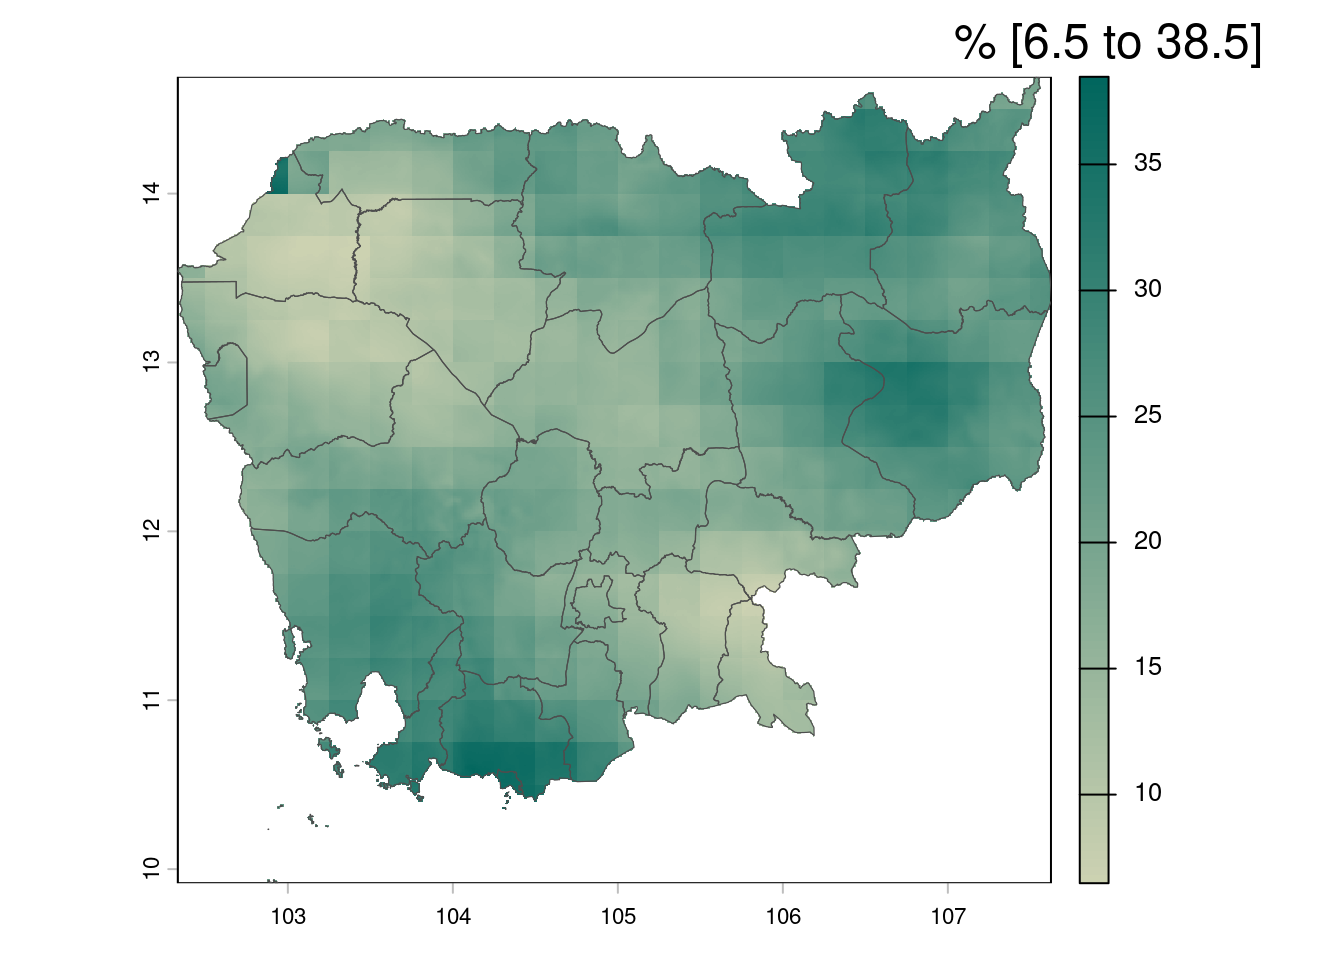
Rx5day
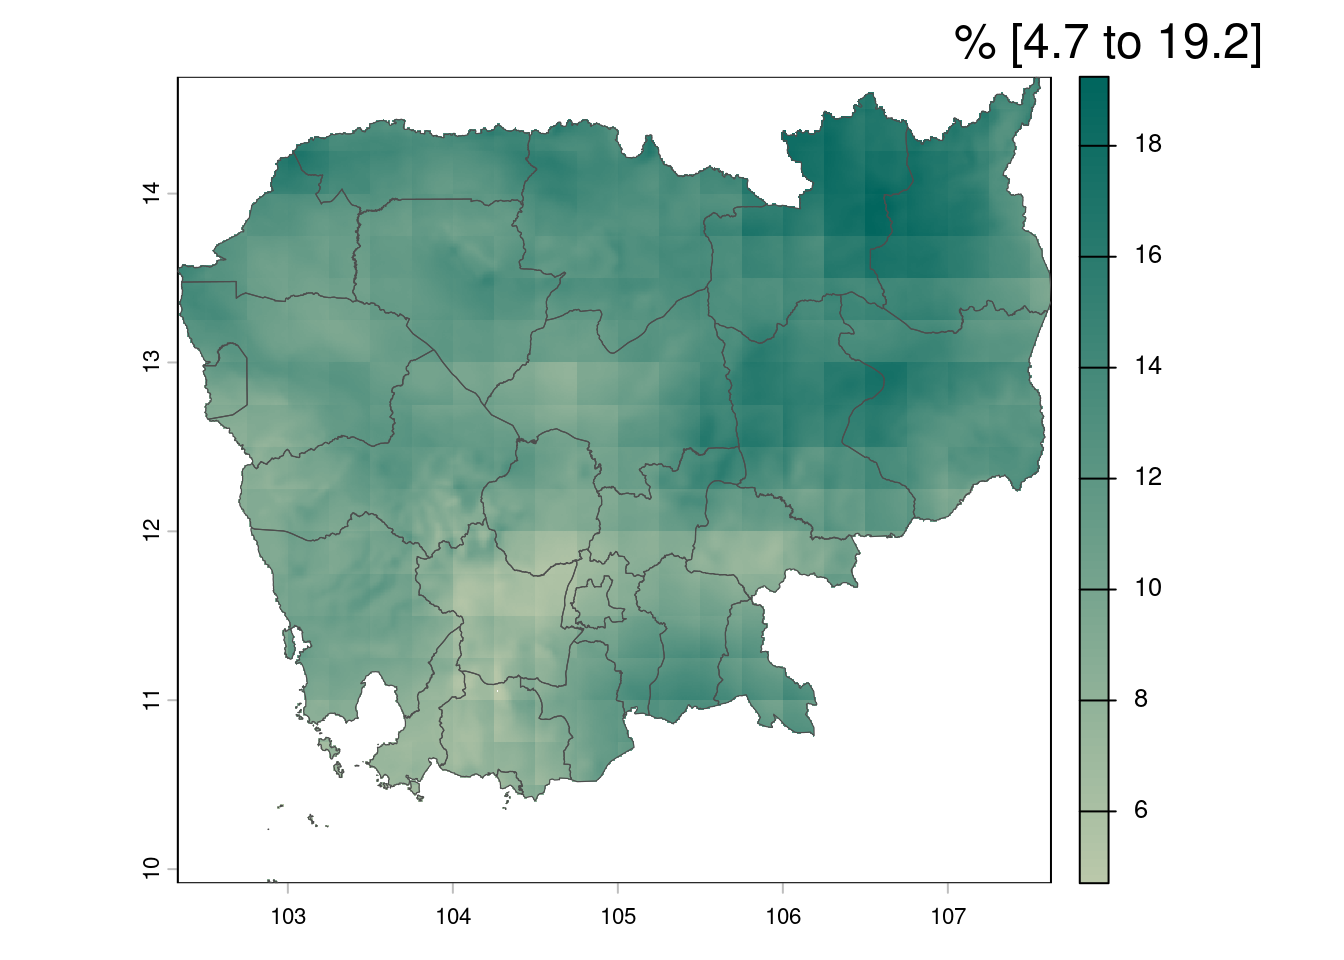
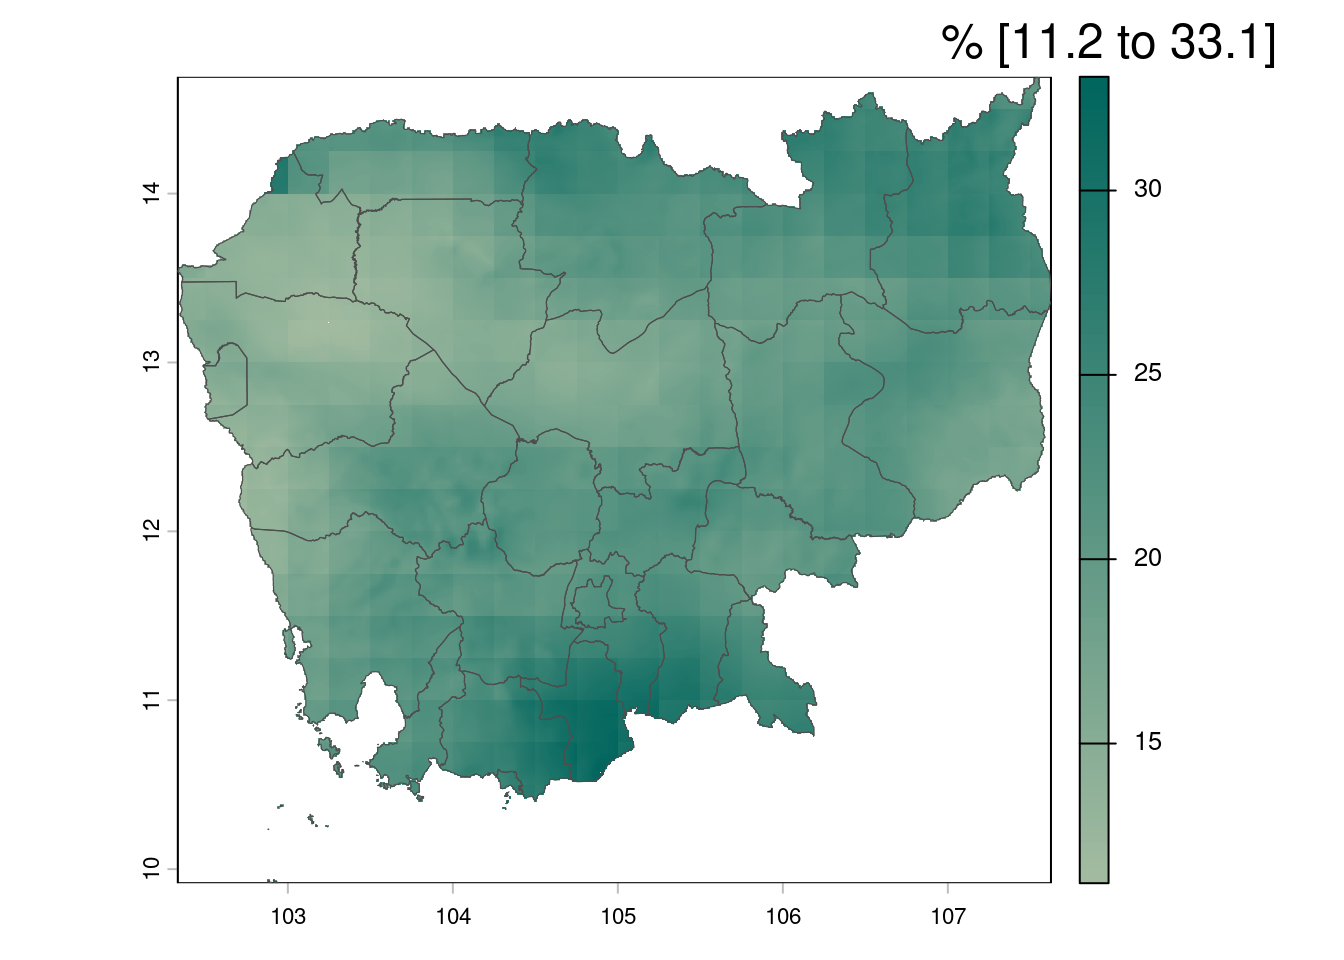
CDD
Data and methods
Observed baseline: CHELSA-W5E5, 1981-2010, 1 km resolution (Karger et al., 2023, Karger et al., 2022).
Model data: NASA NEX-GDDP-CMIP6, 5-member GCM ensemble (Thrasher et al., 2022).
National extent: every raster is masked to Cambodia’s unbuffered national boundary (GADM level-0) before any statistic or map is produced.
Downscaling / bias correction: Quantile Delta Mapping (QDM; Cannon et al., 2015), implemented via the R package MBC (Cannon, 2026), applied per grid cell, per calendar month, with observed (1981-2010), model historical (1981-2010), and model future (2041-2060 or 2061-2080) days for that month pooled across all years before correction — e.g. every January day from 1981 through 2010 is treated as one combined sample, not corrected year by year.
Method strengths and limitations: QDM is a well-established, widely used bias-correction and downscaling method. A specific strength is that it addresses the non-stationarity problem affecting the simpler quantile mapping (QM) method: rather than assuming the model’s relationship to observations stays fixed from the historical period into the future, QDM accounts for the model’s own projected change at each quantile. This means extreme values are better represented in the downscaled data than with QM, which can distort the size of the projected change specifically at the extremes. One limitation worth noting: temperature and precipitation are each corrected separately, so corrected temperature and precipitation values on any given day are not constrained to be physically consistent with each other.
Indices: eight indices, four from
tasmax(daily maximum near-surface air temperature) andtasmin(daily minimum near-surface air temperature), and four frompr(daily precipitation), following the general approach of the ETCCDI/CLIMDEX extreme indices (Zhang et al., 2011), with HotDays35 and AnnualMeanTemp using thresholds/conventions adapted for this study rather than the standard ETCCDI definitions:Index Meaning AnnualMeanTemp mean annual temperature, ( tasmax+tasmin)/2AnnualPrecip total annual precipitation TXx hottest day of the year (maximum of daily tasmax)TNn coldest night of the year (minimum of daily tasmin)HotDays35 number of days per year with tasmaxabove 35°CRx1day wettest single day of the year (maximum 1-day precipitation) Rx5day wettest 5-day spell of the year (maximum 5-day cumulative precipitation) CDD longest run of consecutive dry days (<1 mm) in the year Ensemble: cell-wise mean of each GCM’s own, independently calculated index value (not an index calculated from an averaged daily series), computed separately for each scenario, period, and index, after each model’s own full QDM correction and index calculation. See the note under Overview regarding the EC-Earth3-Veg-LR substitution relative to the Climate Profile Cambodia (WorldClim) ensemble.
Change / anomaly: ensemble mean future value minus the observed baseline value, per cell.
Provincial boundaries: GADM level-1 administrative boundaries (Cambodia), overlaid on every map for geographic reference.
References
Cannon, A.J. (2026). MBC: Multivariate Bias Correction of Climate Model Outputs. R package version 0.10-8.
Cannon, A.J., Sobie, S.R., & Murdock, T.Q. (2015). Bias correction of GCM precipitation by quantile mapping: how well do methods preserve changes in quantiles and extremes? Journal of Climate, 28(17), 6938-6959. https://doi.org/10.1175/JCLI-D-14-00754.1
Karger, D.N., Conrad, O., Böhner, J., Kawohl, T., Kreft, H., Soria-Auza, R.W., Zimmermann, N.E., Linder, H.P., & Kessler, M. (2023). CHELSA-W5E5: daily 1 km meteorological forcing data for climate impact studies. Earth System Science Data, 15(6), 2445-2464. https://doi.org/10.5194/essd-15-2445-2023
Karger, D. N., Lange, S., Hari, C., Reyer, C. P. O., & Zimmermann, N. E. (2022). CHELSA-W5E5 v1.0: W5E5 v1.0 downscaled with CHELSA v2.0. ISIMIP Repository. https://doi.org/10.48364/ISIMIP.836809.3
Thrasher, B., Wang, W., Michaelis, A., Melton, F., Lee, T., & Nemani, R. (2022). NASA Global Daily Downscaled Projections, CMIP6. Scientific Data, 9, 262. https://doi.org/10.1038/s41597-022-01393-4
Zhang, X., Alexander, L., Hegerl, G.C., Jones, P., Klein Tank, A., Peterson, T.C., Trewin, B., & Zwiers, F.W. (2011). Indices for monitoring changes in extremes based on daily temperature and precipitation data. WIREs Climate Change, 2(6), 851-870. https://doi.org/10.1002/wcc.147
Citing this report
When referring to this report or the maps it produces, please cite:
Cooper, R.T. (2026). Cambodia Climate Indices: QDM-Downscaled Baseline, Projected Change, and Ensemble Maps. Sustainable OS International. https://sustainableos.international
This citation is separate from the underlying climate data sources listed under References above — please cite those directly wherever specific figures or values from this report are used in a publication.