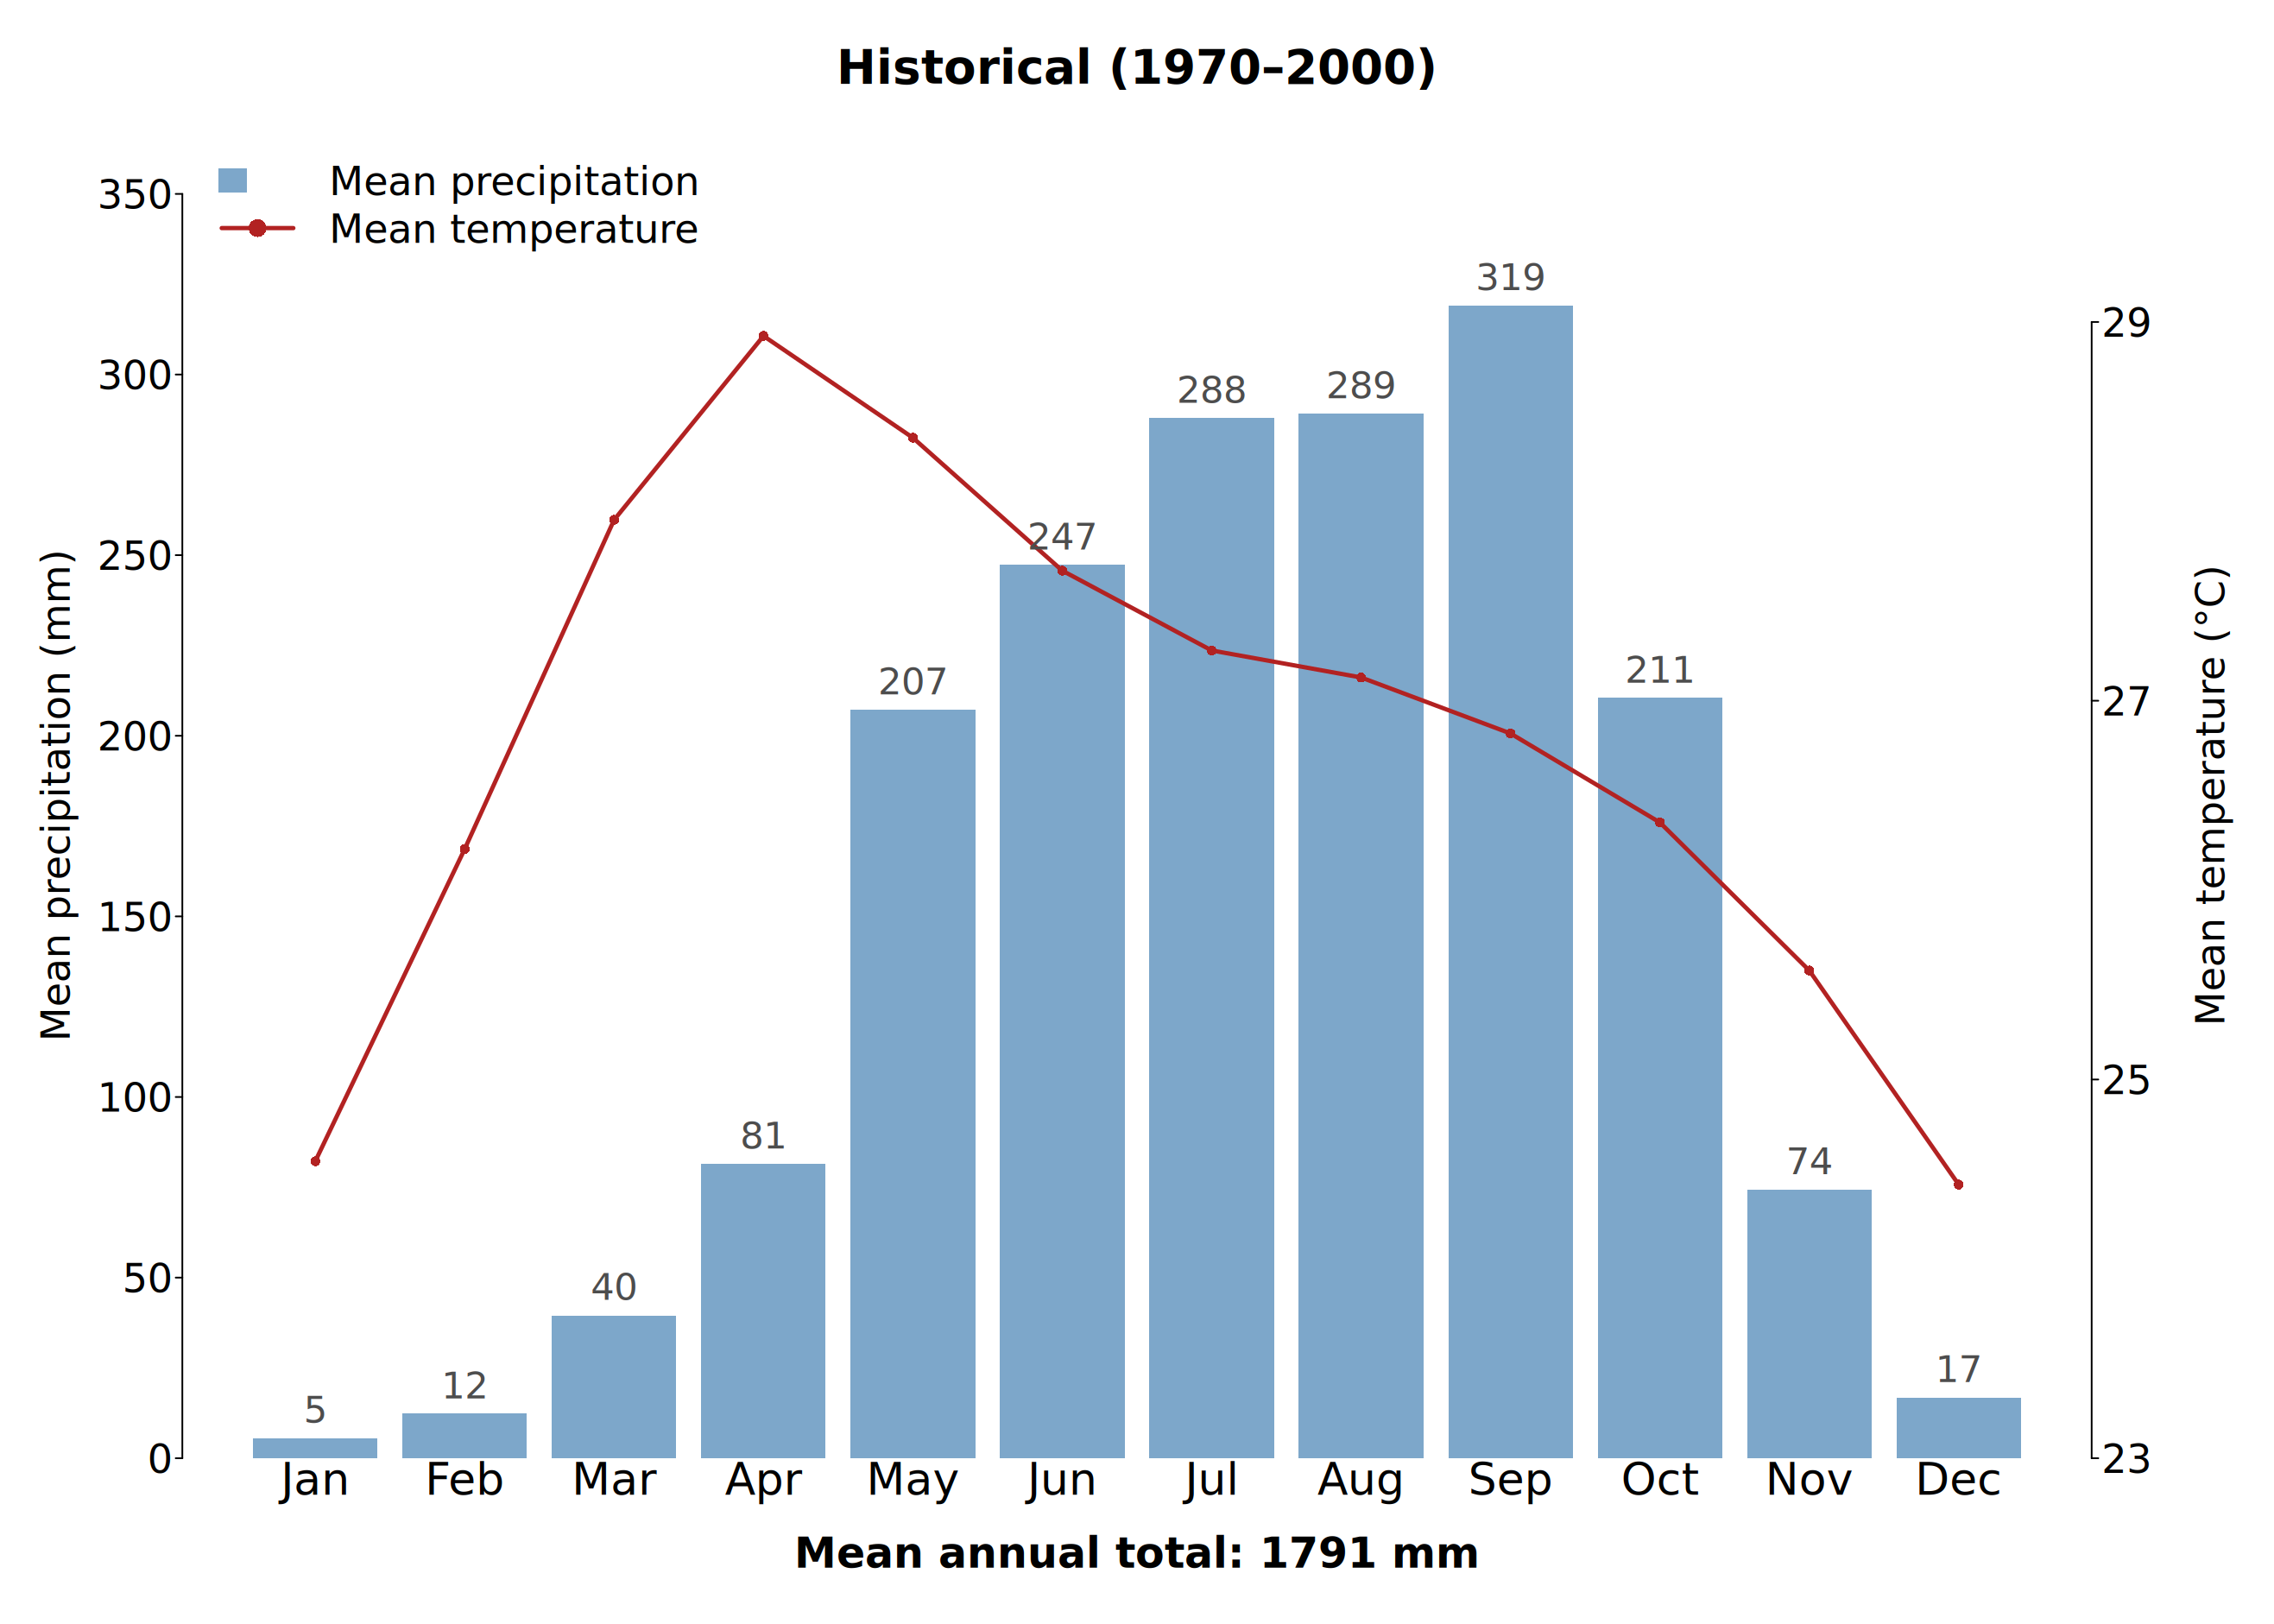
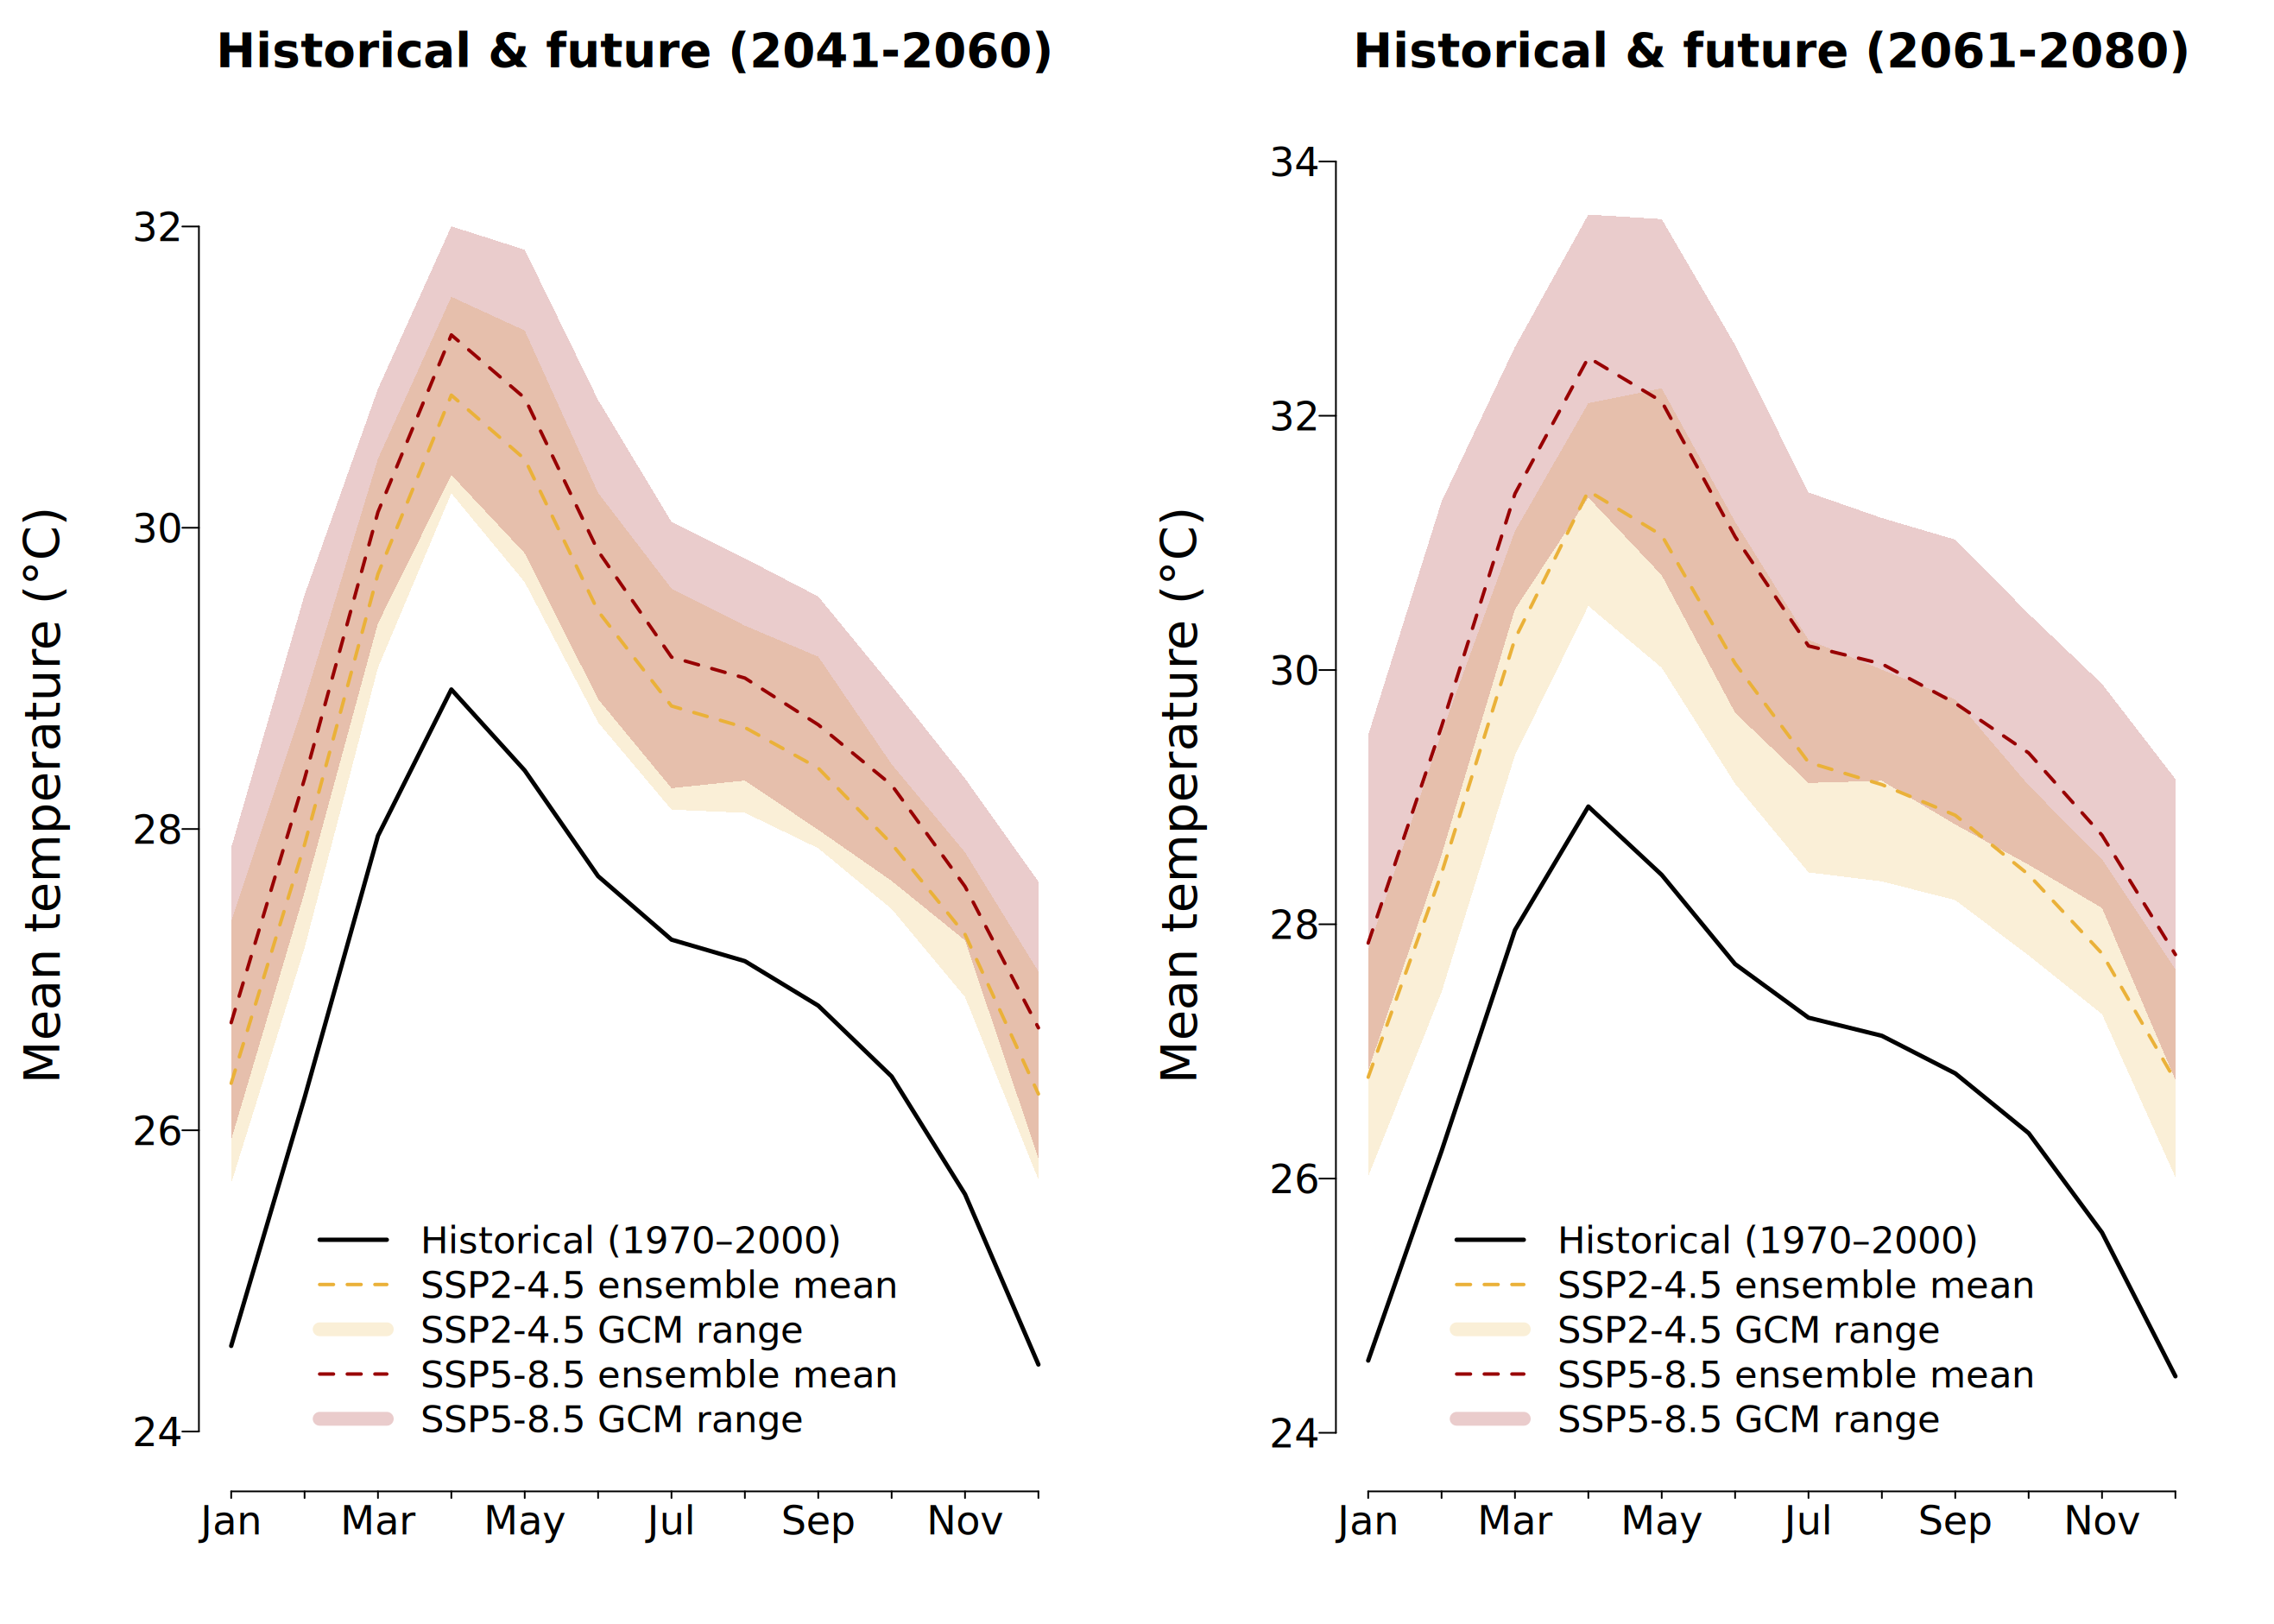
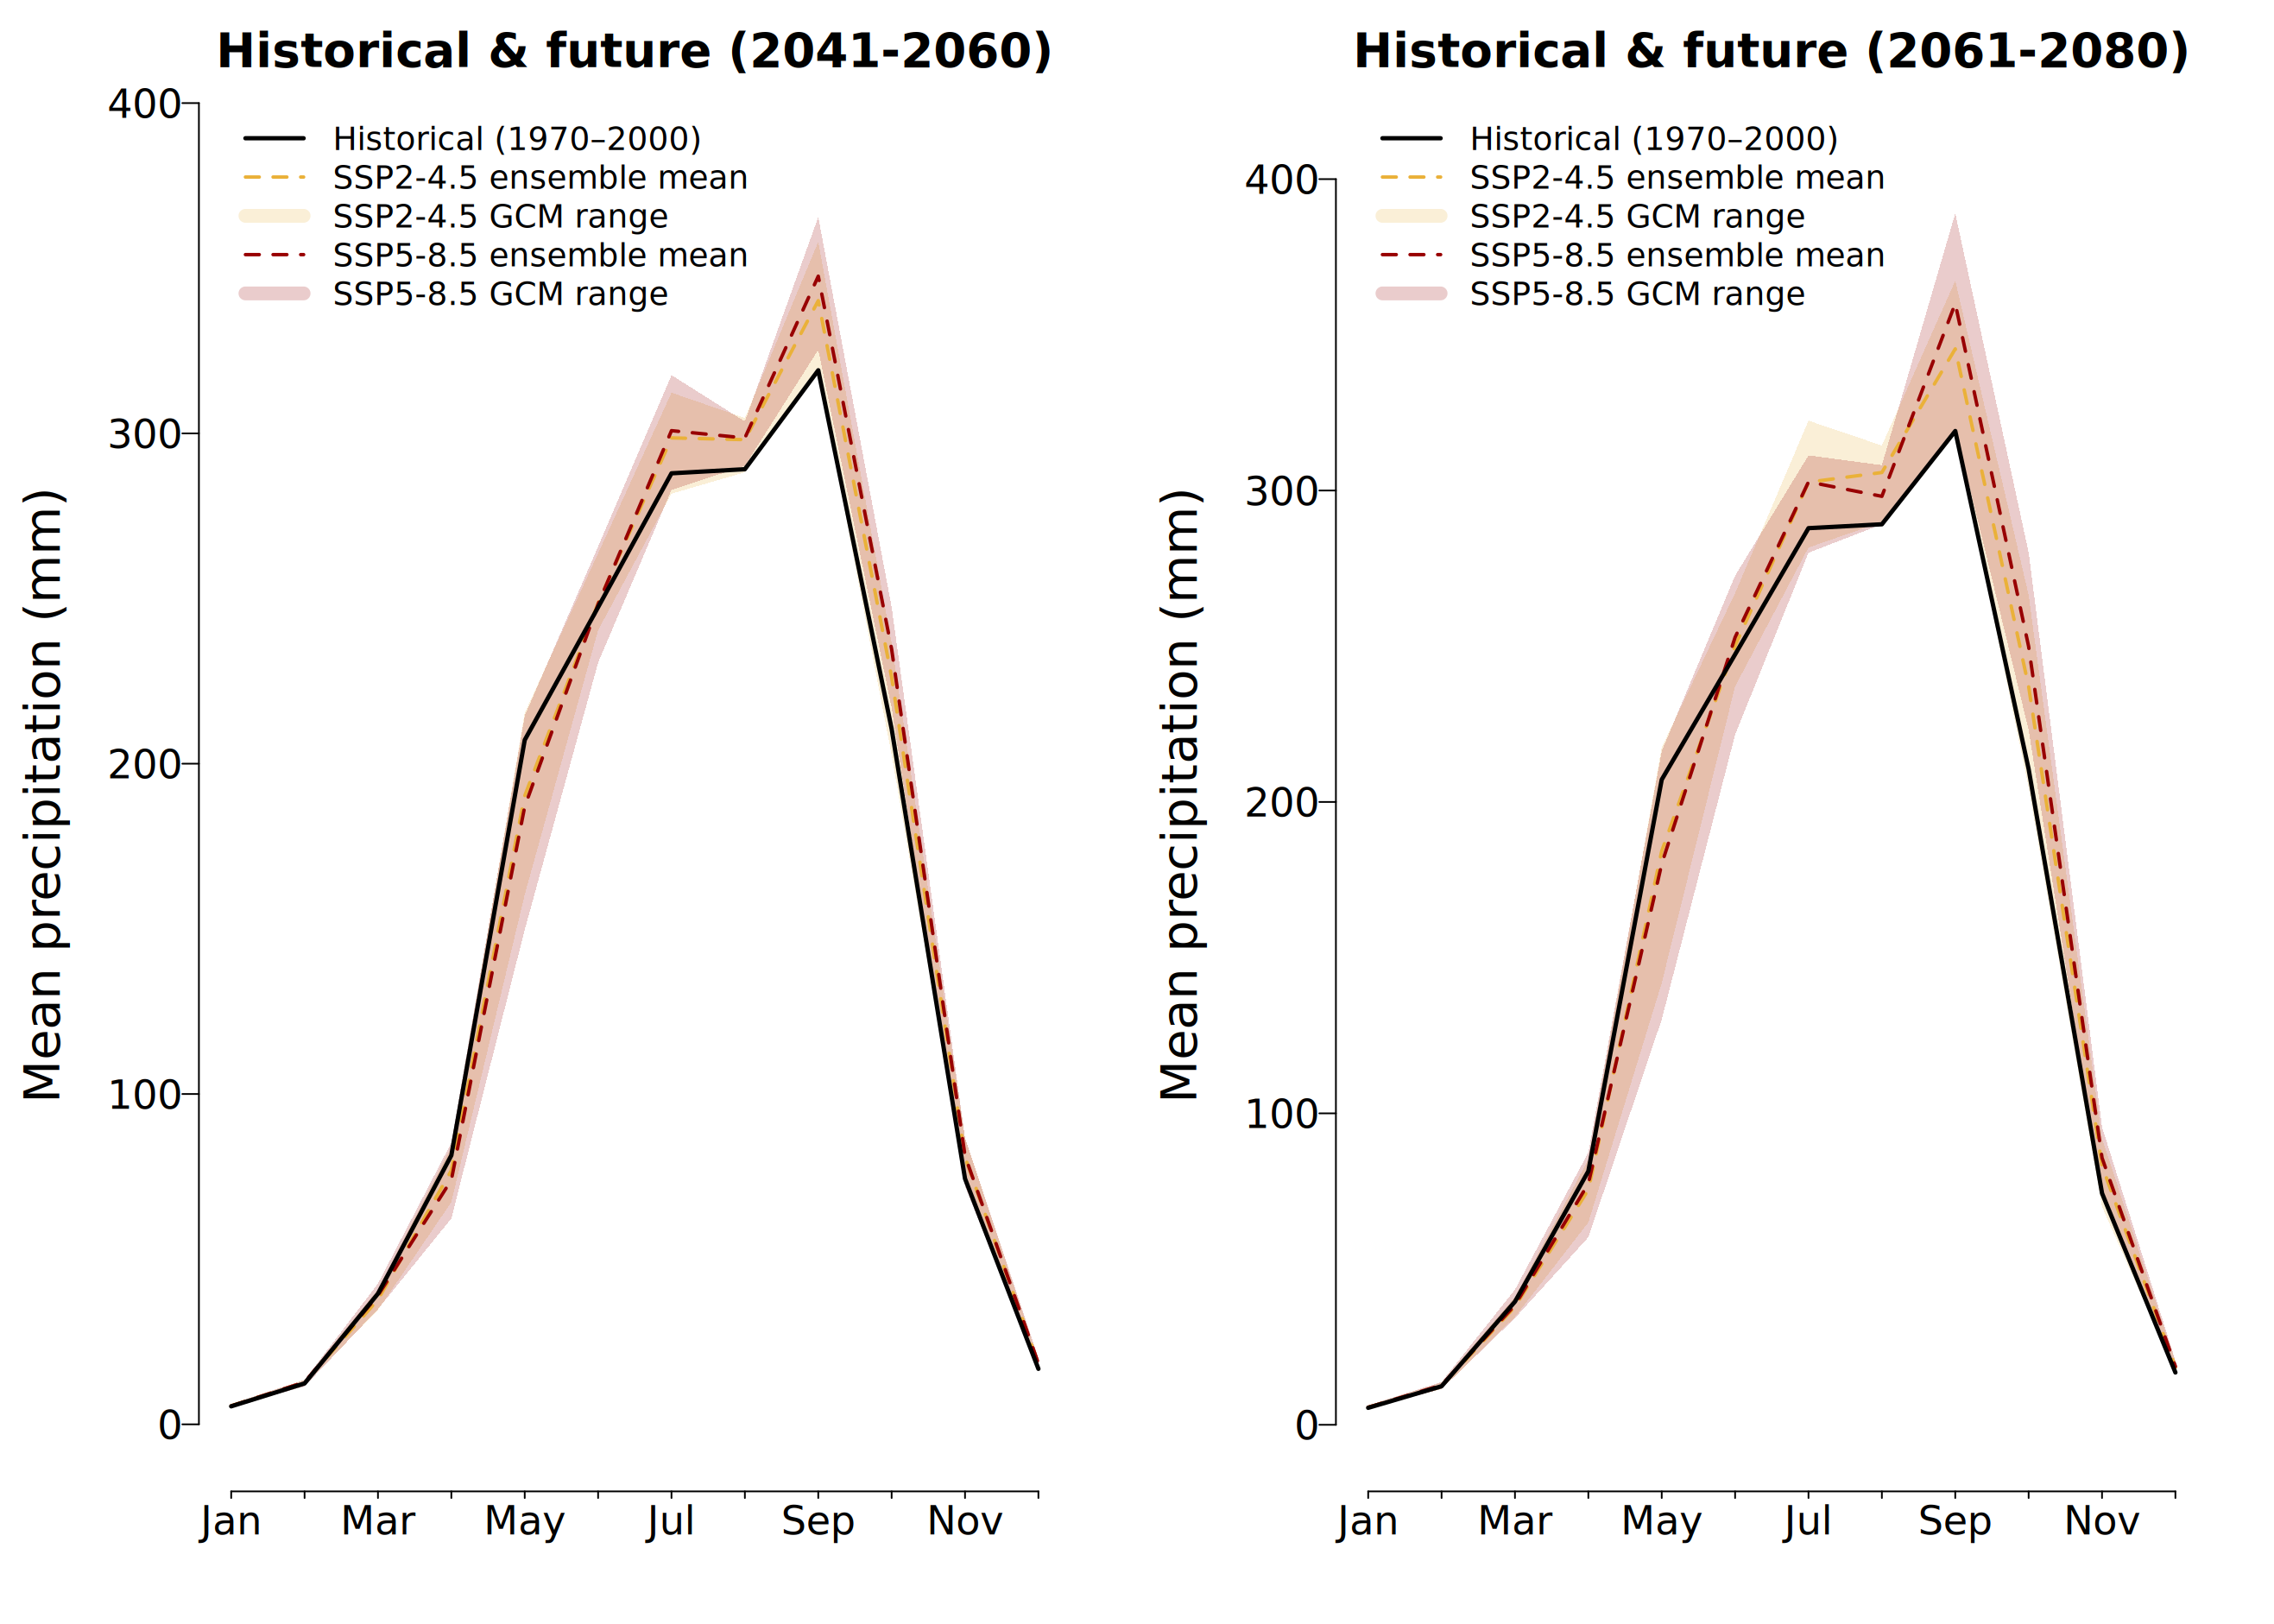
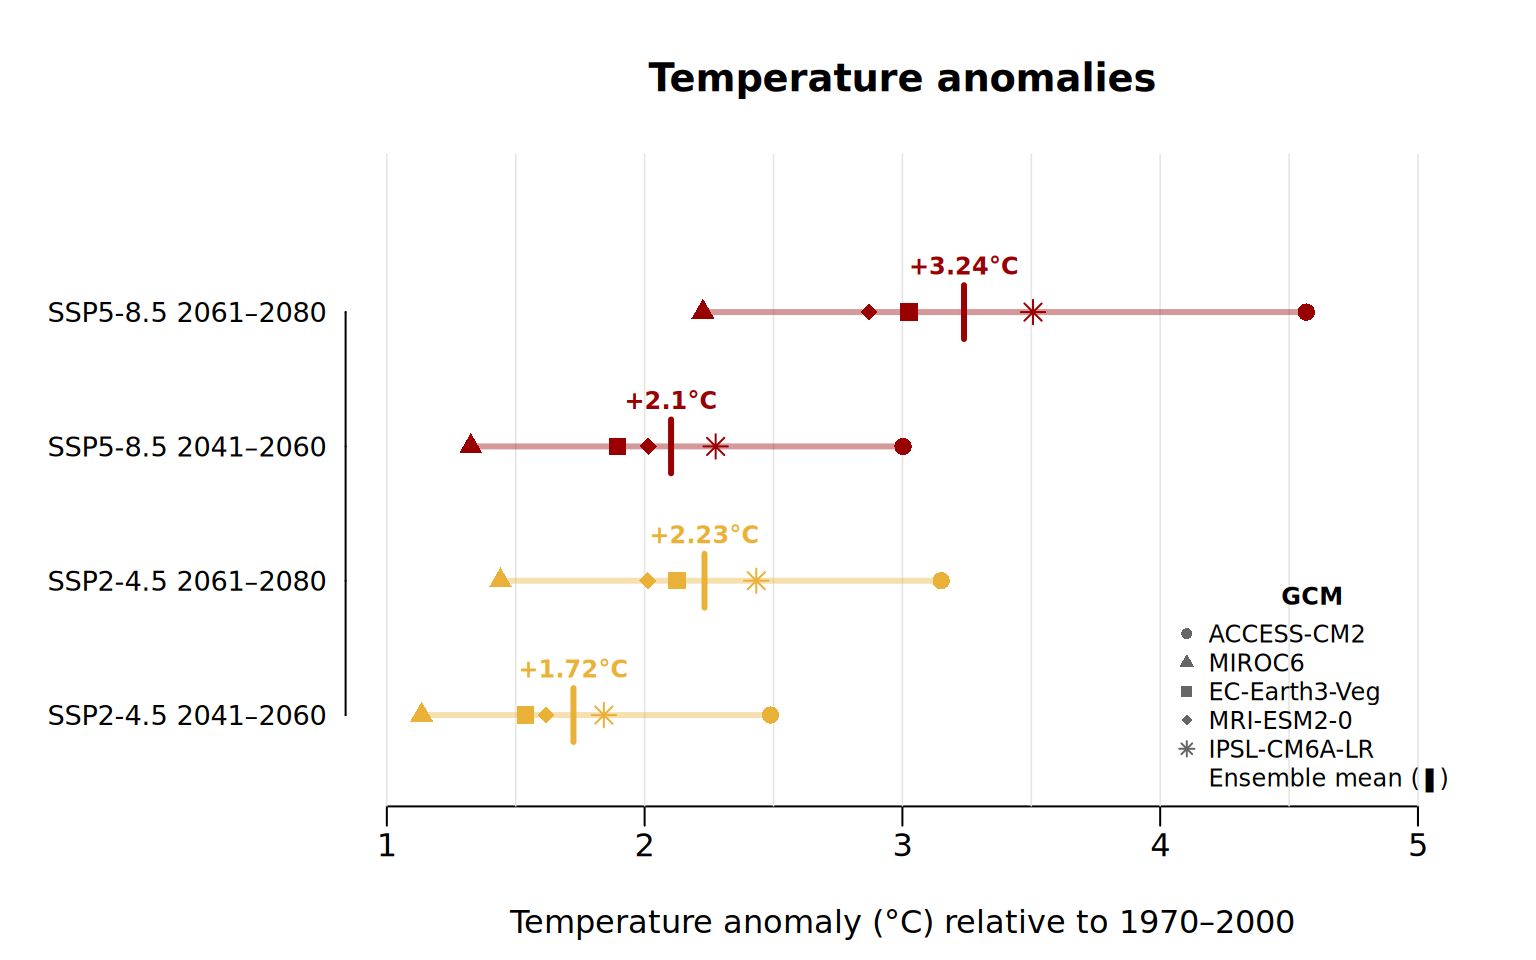
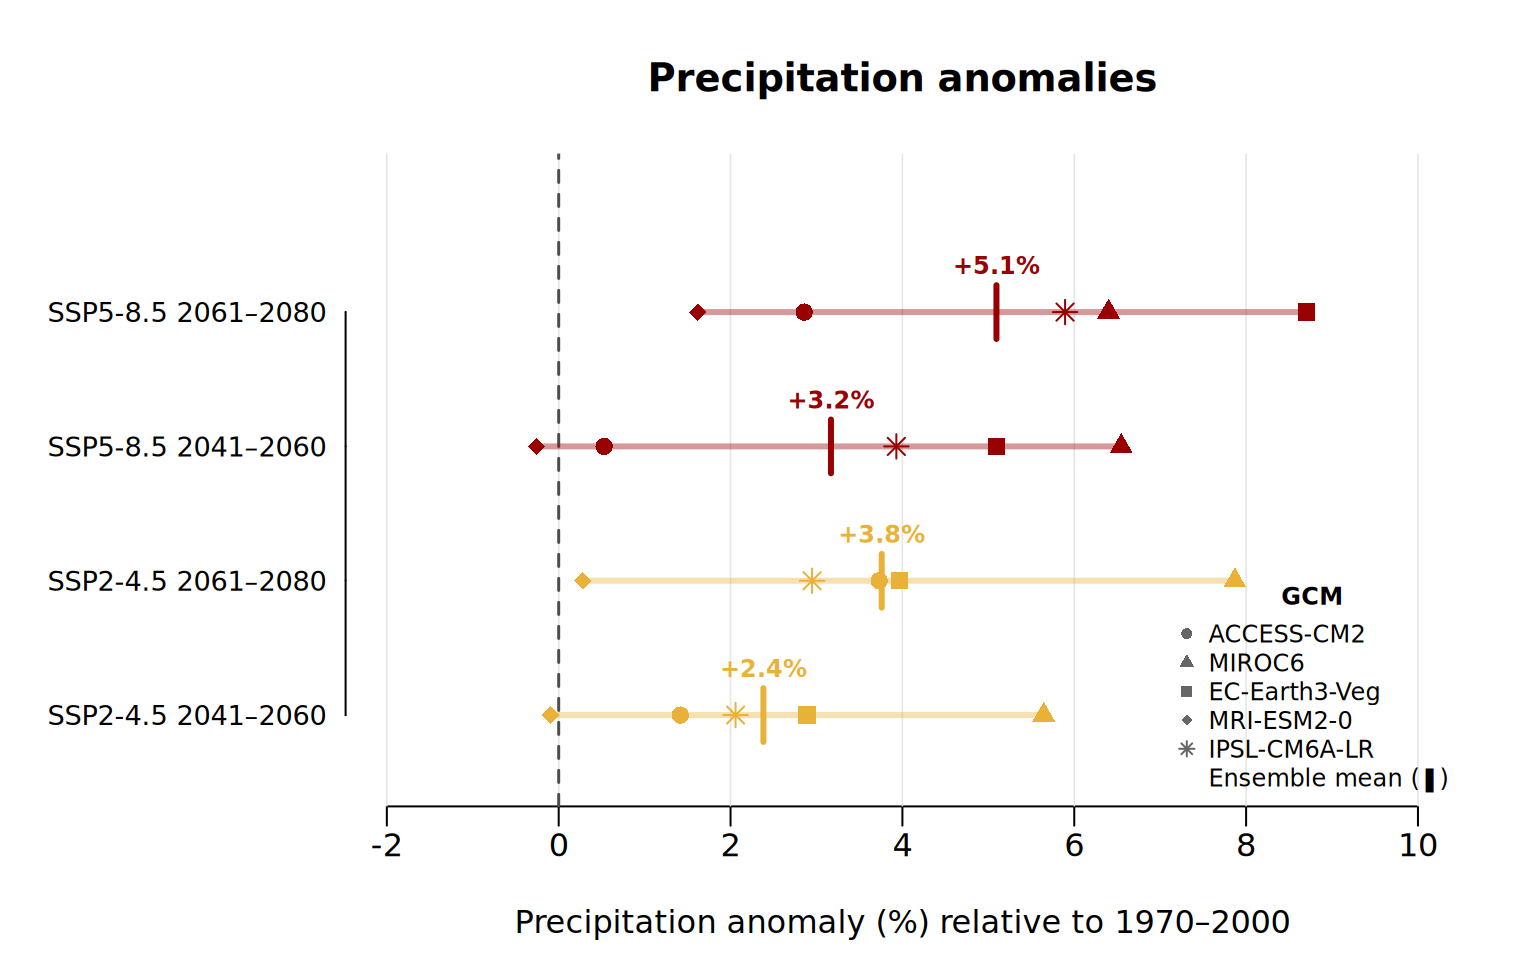
Annual mean temperature and precipitation anomalies by GCM (national), showing ensemble means and model ranges.
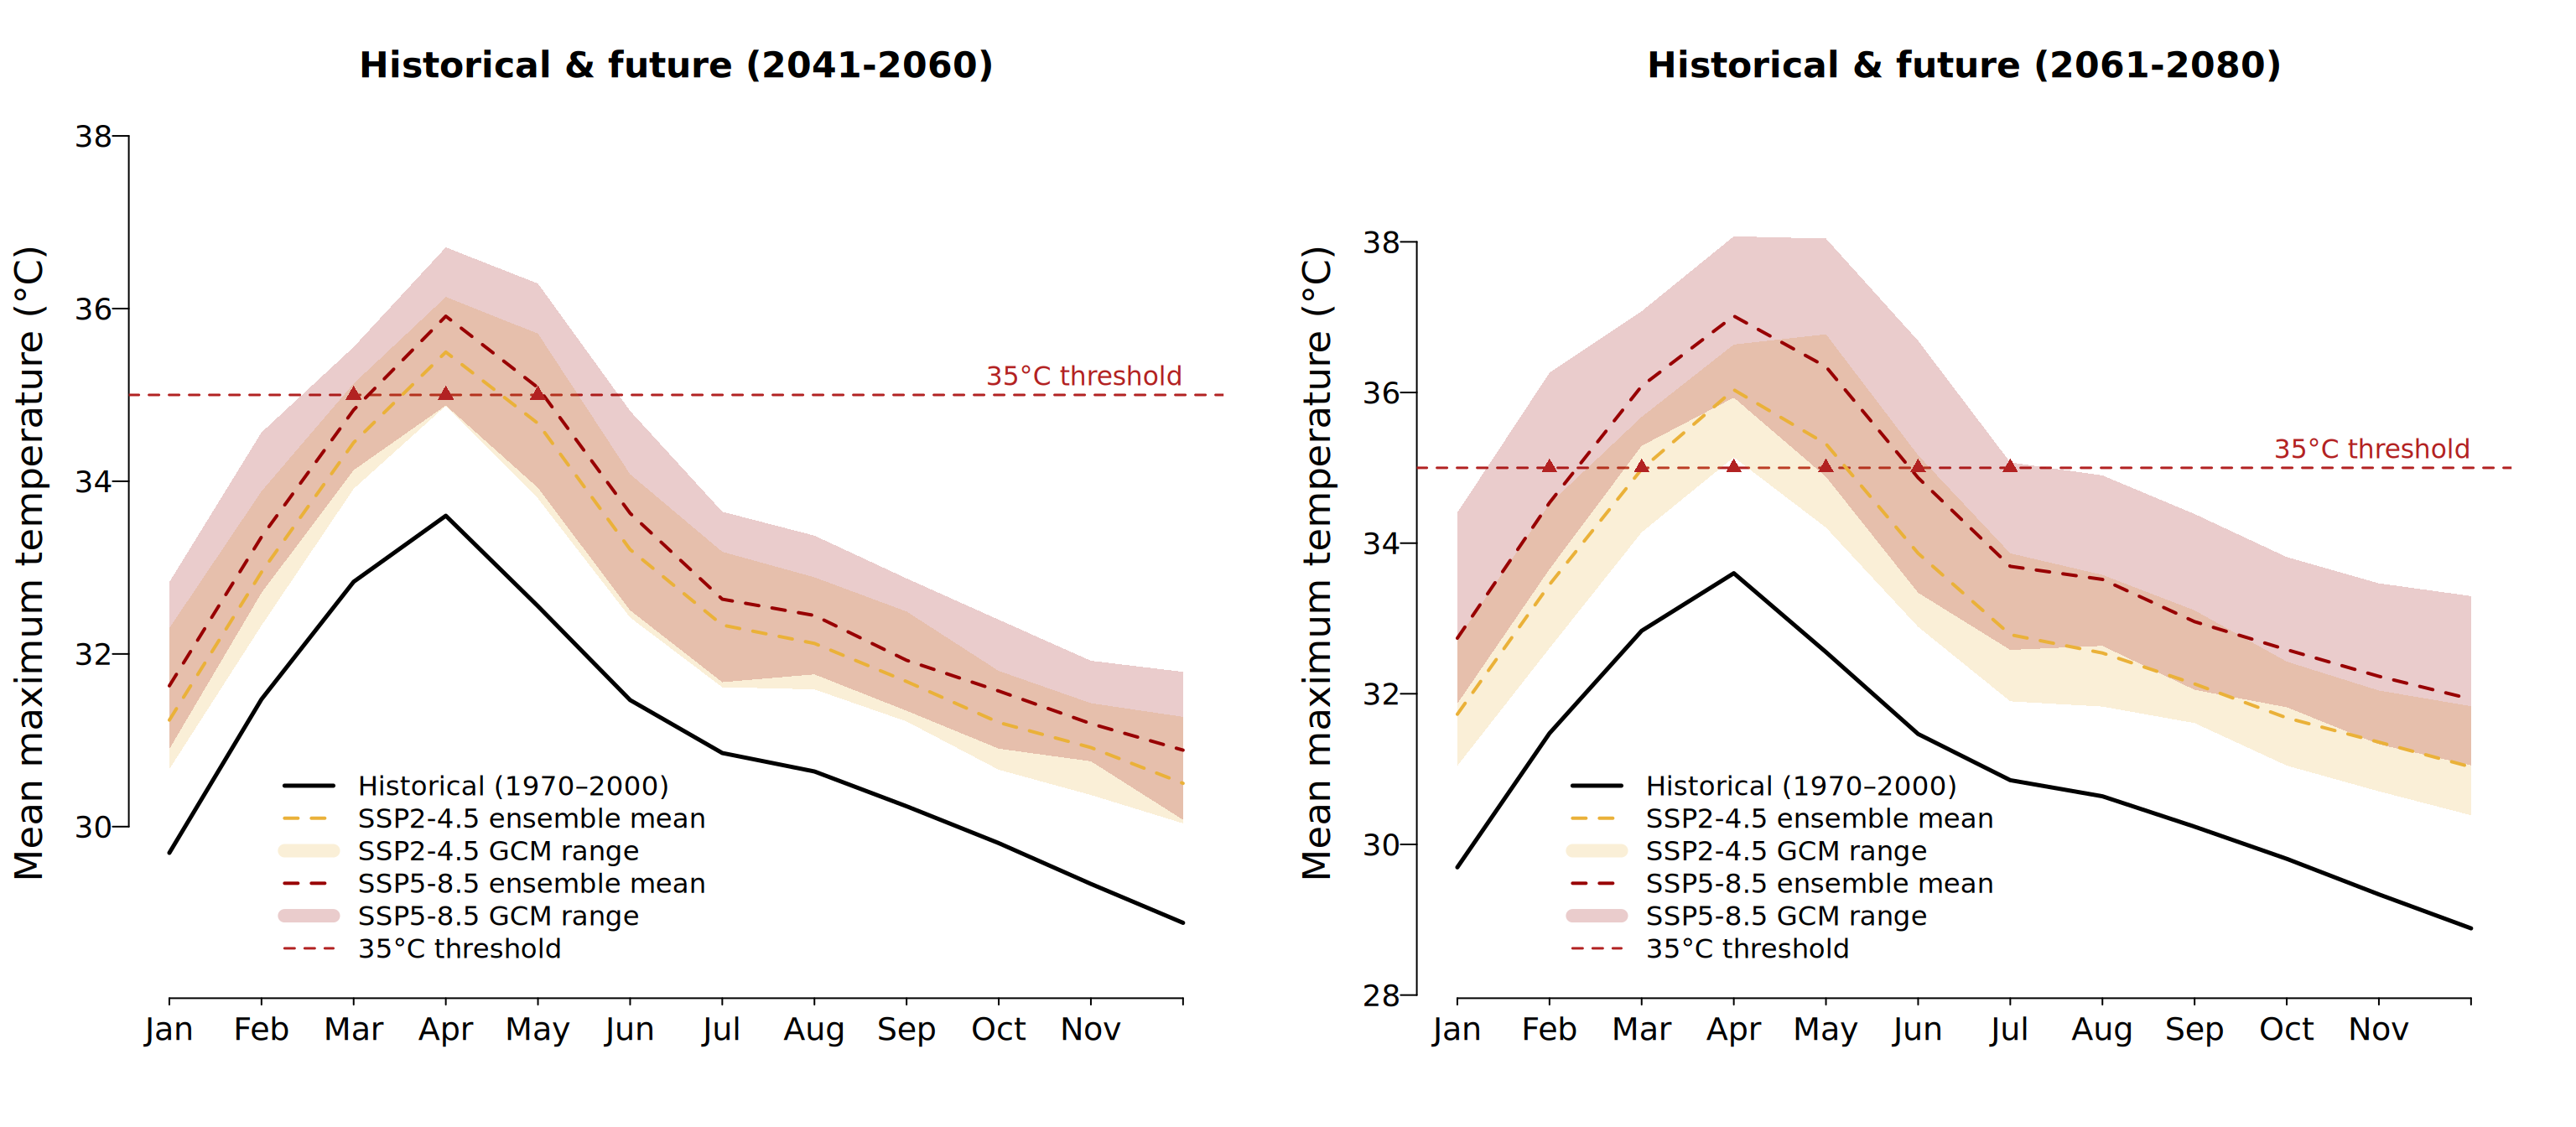
Monthly mean Tmax and 35°C threshold — historical and future projections
The plots identify which months reach and exceed the monthly mean of 35°C.
Communicating climate information
Designed for climate practitioners and non-specialist stakeholders—including government agencies, development partners, and communities—this dashboard replaces static technical reports with an interactive map to make historical and projected climate data accessible.
Fully open source software stack
The tool is built entirely on free, open-source software — R, Quarto, and Leaflet — with no proprietary licences. This keeps costs down, avoids licensing restrictions, and prevents locking an organisation into a particular vendor’s platform.
Simple deployment & maintenance
There is no dedicated map server to install, configure, or keep running. The whole tool is a set of ordinary web files — HTML, JavaScript, and data — that can be hosted almost anywhere: an agency’s existing web space, or a free static hosting service (e.g., GitHub).
Lightweight and scalable software framework
The application simplifies the integration of spatial datasets without introducing complex, specialised map server technology. Tiling of rasters and vectors has been enabled by utilising Cloud Optimized GeoTIFFs (COGs) and PMTiles for vector layers. Both formats download only the required data on demand using HTTP range requests directly from the Leaflet map viewer. While this approach requires server support for range requests, virtually all modern web servers provide this capability.
The system scales flexibly in size and scope to meet varying project requirements. Note: like any mapping site, this is best viewed in a desktop browser.
Self-contained, with one caveat
The map data currently ships bundled with the app itself, so the whole thing works offline or from a single folder with no external data service dependencies — apart from two third-party basemap tile providers. In case of service interruption to these external providers, a self-hosted digital elevation model (Terrain: elevation) and SOSI basemap (derived from OpenStreetMap) are included as basemap alternatives, along with a road overlay for geographic context.
Climate risk assessment decision support tool
This tool forms the basis for a decision support tool under development to integrate outputs from a climate risk assessment adopting the IPCC AR5/AR6 climate risk concept, including hazard, exposure, and vulnerability (sensitivity and adaptive capacity) indicators.
Citing this tool
When referring to this tool or the maps it produces, please cite:
Cooper, R.T. (2026). Climate Profile Cambodia: A lightweight, accessible, open-source tool for communicating climate information to practitioners. Sustainable OS International. https://sustainableos.international
The tool citation above is separate from the underlying climate/elevation/roads data sources — please cite those directly wherever specific figures or values from the dashboard are used in a publication.