Open Geospatial Data for Sustainability:
Exploring and visualising with R
The PDF version can be downloaded from GumRoad at https://richardtcooper.gumroad.com/l/cukbcp
Excerpts are shared below.

Table of Contents
Introduction
This book targets two audiences: readers with little or no technical knowledge of GIS and remote sensing who want to learn about current global open datasets relevant to sustainable development, and GIS professionals interested in using R to work with open geospatial data.
The book contains about 90 figures that include visualising datasets relevant to sustainable development, including those related to forests, rivers and drainage basins, mangroves, biodiversity conservation, infrastructure, land cover and land use, floods, droughts, and fires. There is also a chapter on boundaries that enable the worldwide delineation of political and administrative boundaries on land and sea.
While Southeast Asia is the primary focus of the examples, the datasets are global in scope, and the book’s guidance can be applied more broadly.
…
Coding in R with RStudio
This chapter explains how to code and use the R scripts in this book with the RStudio application. RStudio is a software tool that is commonly used for coding in R - also called an integrated development environment (IDE). This chapter provides details on RStudio’s installation and its use. An introduction to R coding is given, including an overview of R data types and data structures.

…
Boundaries
This chapter presents a selection of open datasets that are useful for delineating political and administrative divisions, including national and subnational boundaries (section 2.3), shorelines (section 2.4), and maritime jurisdictions (section 2.5). The geoBoundaries Global Database of Political Administrative Boundaries (Runfola et al., 2020) is a key open dataset for plotting administrative units. Shorelines can be derived from the Global Self-consistent, Hierarchical, High-resolution Geography (GSHHG) database (NCEI, n.d.) 1 , OpenStreetMap (OSM) (OSM, n.d.), and the Global Shoreline Vector (GSV) (Sayre et al., 2019). Maritime boundaries can be delineated from the Marine Regions databases managed by the Flanders Marine Institute, Belgium (VLIZ, n.d.-a).
…

…
Forests
Contemporary global forest cover datasets examined in this chapter to analyse and visualise forest cover gain and loss include Global Forest Change (Hansen et al. 2013), Global Land Cover and Land Use Change, 2000-2020 (Potapov et al. 2022), Tropical Tree Cover (Brandt and Stolle 2021), Spatial Database of Planted Trees (Richter et al. 2024), and WorldCover produced by the European Space Agency (ESA).
…

…

…

…
Rivers and Drainage Basins
This chapter focuses on mapping and visualising rivers and drainage basins. Guidance is provided on rendering 3D maps of drainage basins using digital elevation model (DEM) data and overlaying geographic features such as rivers, water bodies, roads, urban areas, and drainage basin boundaries. The Chao Phraya River basin (CPRB) of Thailand and selected subbasins serve as illustrative examples. The global datasets used in this chapter potentially allow the image rendering of other drainage basins worldwide.
Key datasets used (section 4.2), and technical considerations and prerequisites for image visualisation (section 4.3) are initially addressed. Subsequent sections present the methods used to render 2D and 3D images of the CPRB (section 4.4). Both 2D and 3D images of the entire CPRB, which include a raster forest overlay, are generated in section 4.4.3, and nested subbasins which contain Chiang Mai city, are visualised in section 4.5. Both the larger and smaller subbasins are rendered with Sentinel imagery overlays (Figures 4.11 and 4.13), while the larger subbasin is also presented without a raster image overlay (Figure 4.7). OpenStreetMap (OSM) features are retrieved and overlaid on all rendered scenes.
…

…

…
Mangroves
This chapter focuses on visualizing the spatial extent and changes in mangrove distribution using the Global Mangrove Watch (GMW) dataset (Bunting et al., 2022b; GMW, n.d.) (sections 5.4 and 5.5). Additionally, it describes the mapping of frontal mangrove genera that can be used to inform nature-based solutions (NbS) to safeguard shorelines (Twomey & Lovelock, 2024) (section 5.6). The GMW data are used to visualize the distribution of mangroves along the coastline of Samut Sakhon province, in the northern Gulf of Thailand. The data are first superimposed on OpenStreetMap tiles and then use a global digital elevation model (DEM) to create a three-dimensional scene of the coastline. The R code presented below can be applied to other locations by modifying the boundaries and bounding box coordinates.
…

…
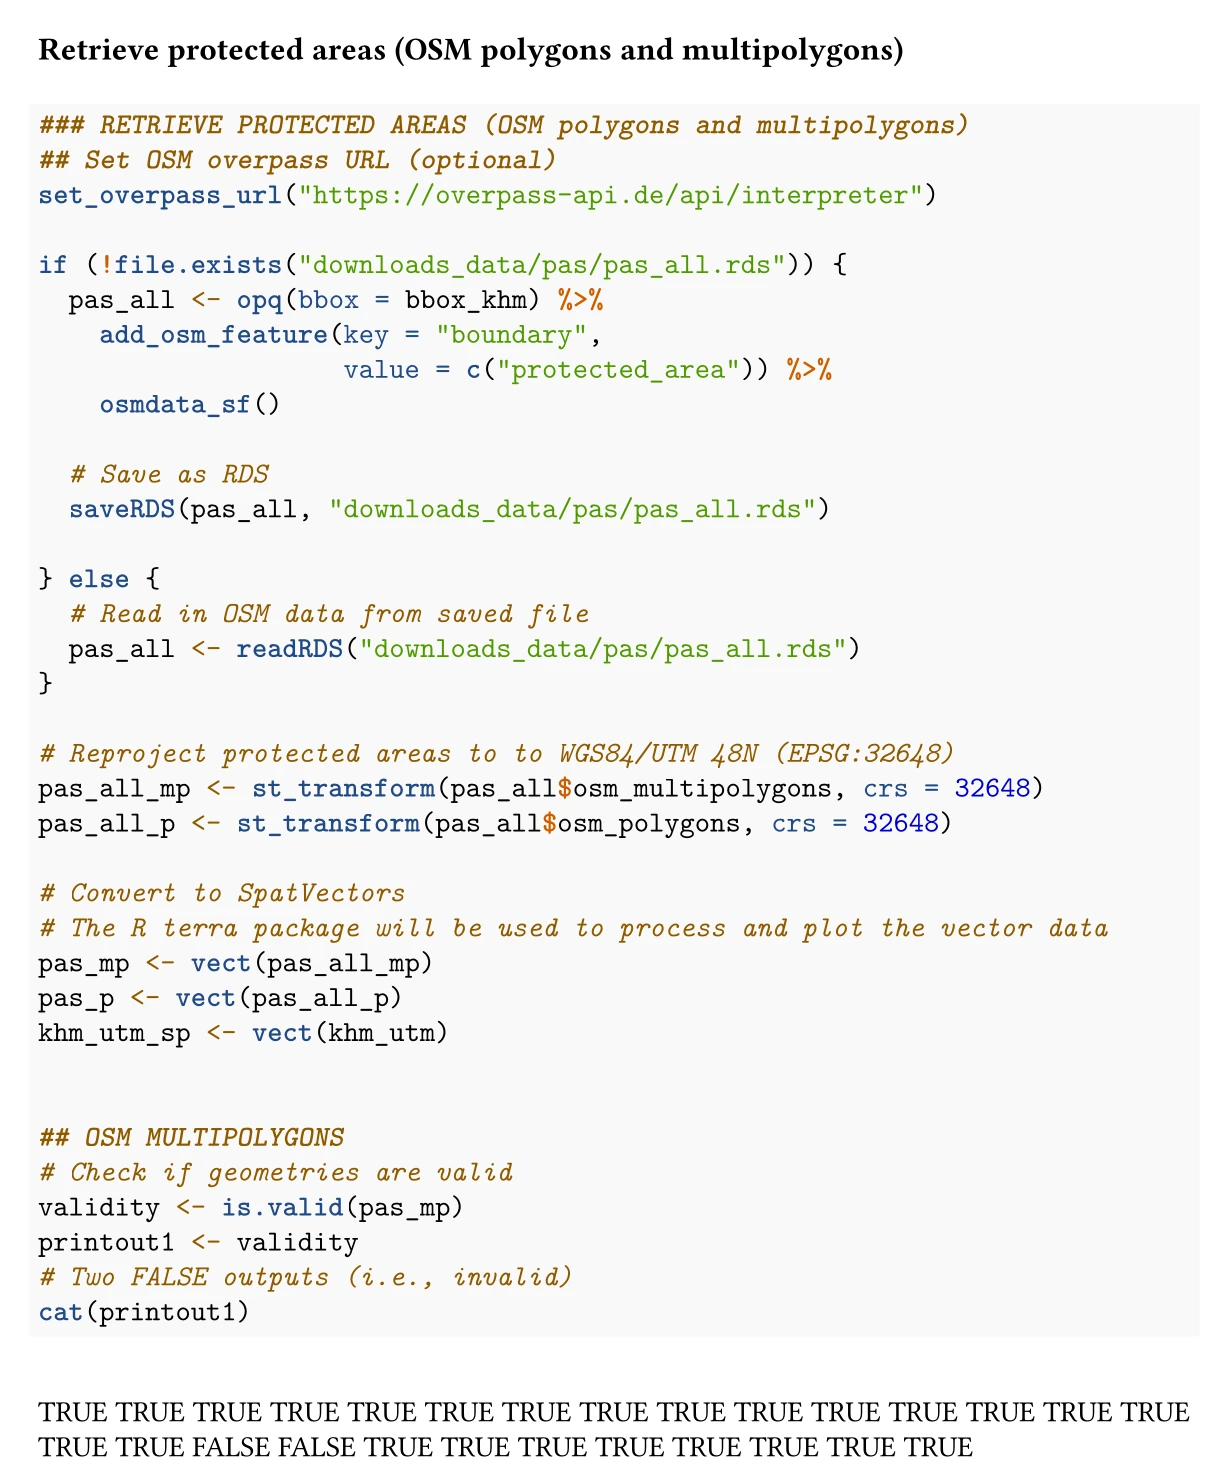
Biodiversity Conservation
Knowledge of the status of protected areas is critical to supporting biodiversity conservation, including for monitoring progress towards meeting internationally agreed biodiversity targets and informing investment decisions (CBD, n.d.-b). The most extensive global database of both marine and terrestrial protected areas is the World Database on Protected Areas (WDPA) (Protected Planet, n.d.-d). The WDPA is a key source of information used for measuring achievement towards meeting biodiversity goals (Protected Planet, n.d.-a). The World Database on Other Effective Area-Based Conservation Measures (WDOECM), which was first released in 2019, supplements the WDPA dataset (Protected Planet, n.d.-c). Both of these datasets are managed by the United Nations Environment Programme - World Conservation Monitoring Centre (UNEP-WCMC) and the International Union for the Conservation of Nature (IUCN). The Key Biodiversity Area GIS database is another important resource for conservation planning (KBAs, n.d.).
…
…
The representativeness of ecoregions in protected areas and national parks is examined. The percentage area of each ecoregion designated as a protected area or national park is calculated (Figure 6.6, Table 6.2).

…

…
Infrastructure
This chapter details open datasets of key infrastructure, including transportation (section 7.4), energy (section 7.5), and water (section 7.6). In addition to OpenStreetMap (OSM), which can provide the most recent snapshot of infrastructure assets globally, other relevant datasets are highlighted. In the following sections, OSM data are retrieved using the R osmdata package, as similarly used in previous chapters. The challenge in using OSM is that more effort is typically required for retrieving and preprocessing data, whereas other datasets may be in a more refined state for immediate use; for instance, in the case of OSM, some features may be missing and data coverage may vary depending on prior mapping effort. Road, railway, and energy datasets are illustrated for the Bangkok Metropolitan Region (BMR), and then canal infrastructure is mapped for Cambodia.
…

…
The canal network in Cambodia is extracted using the waterway:canal tag pair, which is overlaid on, for background context, rivers (waterway:river, natural:water and water:river), streams (waterway:stream), lakes (natural:water and water:lake), and reservoirs (natural:water and water:reservoir) (using the tag pairs indicated in the brackets) (Figure 7.8).

…
Land Cover and Land Use
Selecting an LCLU dataset will depend on study needs, including consideration of spatial resolution, temporal coverage, classification system, and also the level of spatial detail required, as this may vary even when the spatial resolution of the datasets are reportedly the same (Xu et al., 2024). The increasing availability of global open datasets offers potential for studying high-resolution changes in land cover and land use. This chapter highlights the Global 30-meter Land-Cover Dynamics Dataset (GLC_FCS30D) (Zhang et al., 2024), which offers global coverage with a spatial resolution of 30 m, 26 time steps from 1985 to 2022, and 35 land cover categories.
…

…
The key purpose here is to illustrate changes in forest cover and impervious surface cover between 1985 and 2022 as choropleth maps, with each district coloured by the magnitude of change. Thematic choropleth maps of changes in forest and impervious surface area by district are generated using the R terra package.

…
Floods and droughts
Datasets highlighted in the following include those from the Global Flood Awareness System (GloFAS) (Copernicus, n.d.-b) (section 9.4) and global high-resolution standardized precipitation evapotranspiration indices (SPEI-HR) generated by Gebrechorkos et al. (2023b) (section 9.5). GloFAS is part of the Copernicus Emergency Management Service (CEMS), which generates a range of data products for current and future flood events (Copernicus, n.d.-b). These products are shared in near real-time, and there are also static flood maps presented as return periods (recurrence intervals). The flood return period data can be used for a general assessment of flooding, including for assessing exposure of people and assets to river floods (Baugh et al., 2024), and their use is demonstrated below.
…

…
The SPEI-HR indices are available in monthly time steps from January 1981 to December 2022, comprising a total of 504 months, with monthly incremental timescales from 1 to 48 months. The following demonstrates the visualisation of SPEI-HR over timescales of 3, 6, 12, and 24 months for the country of Cambodia. While there are four SPEI-HR datasets available, the MSWEP-hPET dataset is highlighted in this chapter, though ideally all datasets that represent different combinations of precipitation and potential evaporation sources should be used to strengthen drought assessments (Gebrechorkos et al., 2023b).

…
Fires
This chapter shows how to access and visualise geospatial data for mapping fires and burned areas. Data from the Fire Information for Resource Management System (FIRMS) of the National Aeronautics and Space Administration (NASA) can be used to show the location of past and near real-time fires. FIRMS relies on the thermal imaging capabilities of the Moderate Resolution Imaging Spectroradiometer (MODIS) and Visible Infrared Imaging Radiometer Suite (VIIRS) sensors that are carried aboard the Terra, Aqua, Suomi National Polar-orbiting Partnership (S-NPP), and National Oceanic and Atmospheric Administration (NOAA) 20/21 satellites (NASA, n.d.-b). The combination of MODIS and VIIRS sensors provides a comprehensive spatial view of global thermal hotspots on a subdaily basis (Quayle, 2022). VIIRS is more sensitive than the MODIS sensor to hotspot detection given its higher resolution of 375 m compared to 1 km, respectively (NASA, n.d.-h; @ NASA, n.d.-b).
…

…

…
